We’ve run the same strategy multiple times this year… It’s one of my favorite trade setups in the market.
And it just delivered gains AGAIN.

To the untrained eye, a lot of the price action in the market looks random.
It’s not.
Every stock moves for a reason. And a stock’s most recent move influences the next setup. It’s all connected.
Our job is to find price action that’s volatile AND hints at a high-probability second move.
Like this setup…
My Play on RIVN
This is the alert I sent to traders in the afternoon on August 17:

Let’s walk through it…
Remember what I mentioned earlier this week, we are dealing with less volatility in August. I explain the idea here.
Essentially, people are away from their screens enjoying the last few days of summer, taking their kids to school, and returning from European vacations.
That means there are fewer traders at their desks, and less volume in the market. Which directly translates to less volatility.
That’s why I’m buying contracts with longer expirations.
I’m confident in the setups, I just need to give them more time because of the thin trading tape.
With that said, the plays I’m looking for right now are identical to those in a volatile market.
“5 down days in a row make it one of the few truly oversold stocks in the market.”
This is a classic bounce trade after an overextended drop.
When I alerted the setup, RIVN was on its fifth red day and approaching support from earlier this year…
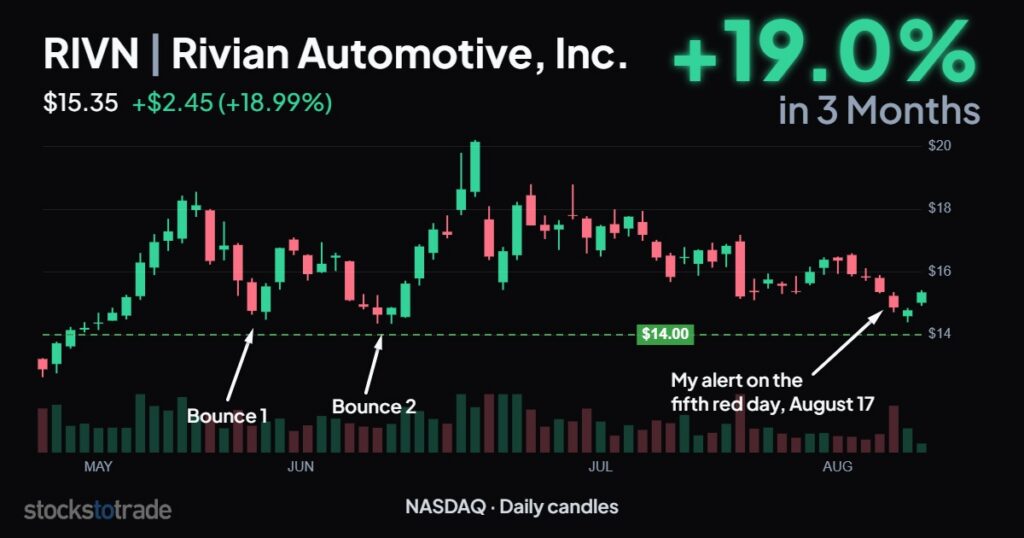
The stock is already following my thesis.
It doesn’t look like much of a bounce on the multi-month chart. But with short-dated options contracts (a 2-week expiration is still short) the bounce on August 19 gets magnified exponentially.
Here’s a better look at the intraday price action this week…
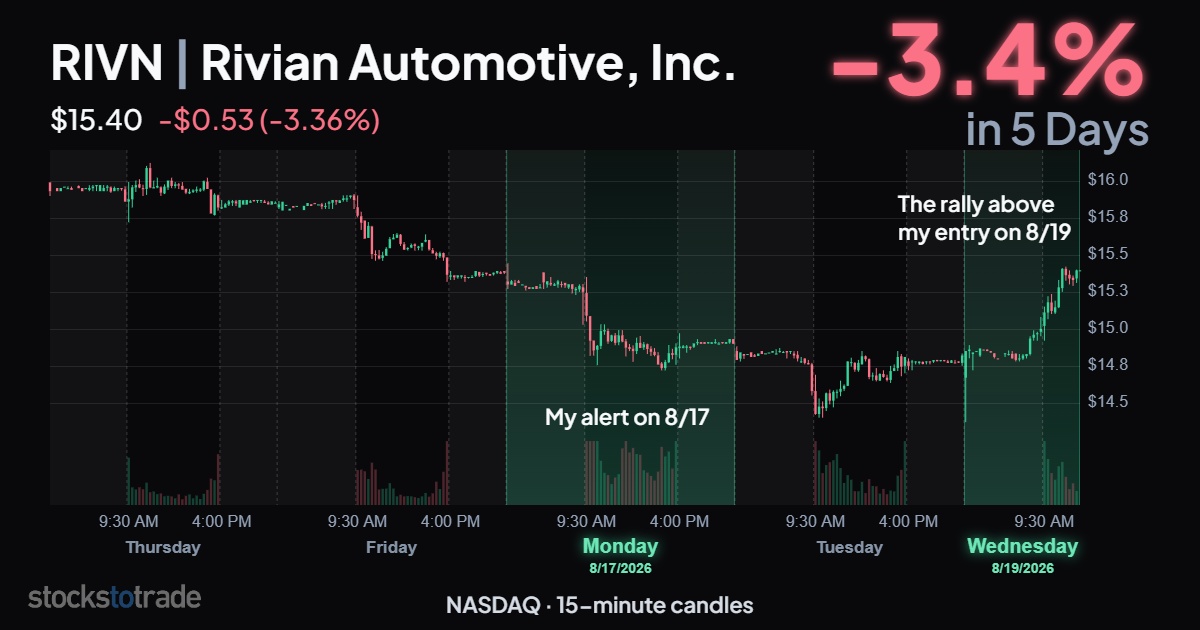
The stock hasn’t quite reached my $16 per-share target, but we’re well on our way, and I’ve got time to wait.
The Next Setup
This was a reversion trade.
When stocks stretch too far from fair value, they tend to snap back toward major moving averages.
To find a stock’s “fair value”, my three favorite moving averages are the 50, 100, and 200-day Simple Moving Averages (SMA).
Look how RIVN has responded in the past when it stretches too far from those levels:
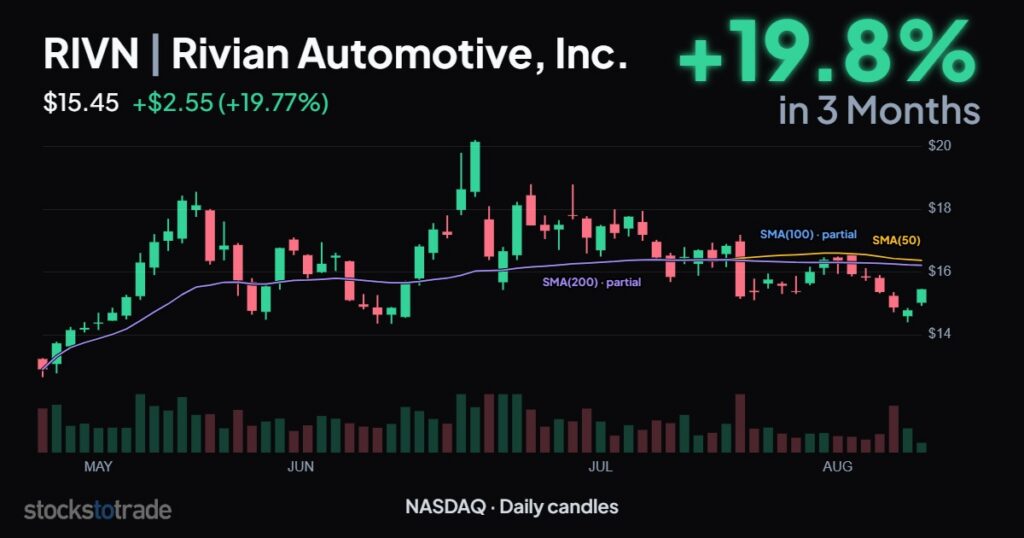
“Ok, I see the stock was stretched below the SMAs on August 17, but how do we know when to buy?”
In the case of RIVN, the price was approaching support at $14.
I’m always using a combination of indicators for technical analysis…
A stock’s price action is not random. It just looks that way because you’re not familiar with the market yet.
You could fumble around for the next few months, putting together puzzle pieces until you get the whole picture…
Or you could attend the 2-day bootcamp.
You just missed my most recent bootcamp. But the next one is right around the corner, on September 8 and 9.
Once you have this strategy in your arsenal, you can reuse it on the next setup, and the next one, and the next one…
Get ready for the volatility to return this fall.
Reserve your spot NOW for my 2-day bootcamp.
Stay Street Smart,
Jeff Zananiri
*Past performance does not indicate future results, Not typical.