The market keeps climbing with a single source of strength…
Hope.
- Hope that Trump signs a deal with Iran.
- Hope that chip stocks never cool off.
- Hope that the music plays long enough for traders to get out with gains.
My strategy doesn’t rely on hope… Today @ 1 P.M. EST.
Here’s a live look at the market’s bull traders at these levels:

Keep hopping around, Superman… maybe you’ll learn to fly someday.
Hope isn’t a trading strategy. That’s why I’m getting ready for an imminent pullback. This market is ripe with denial.
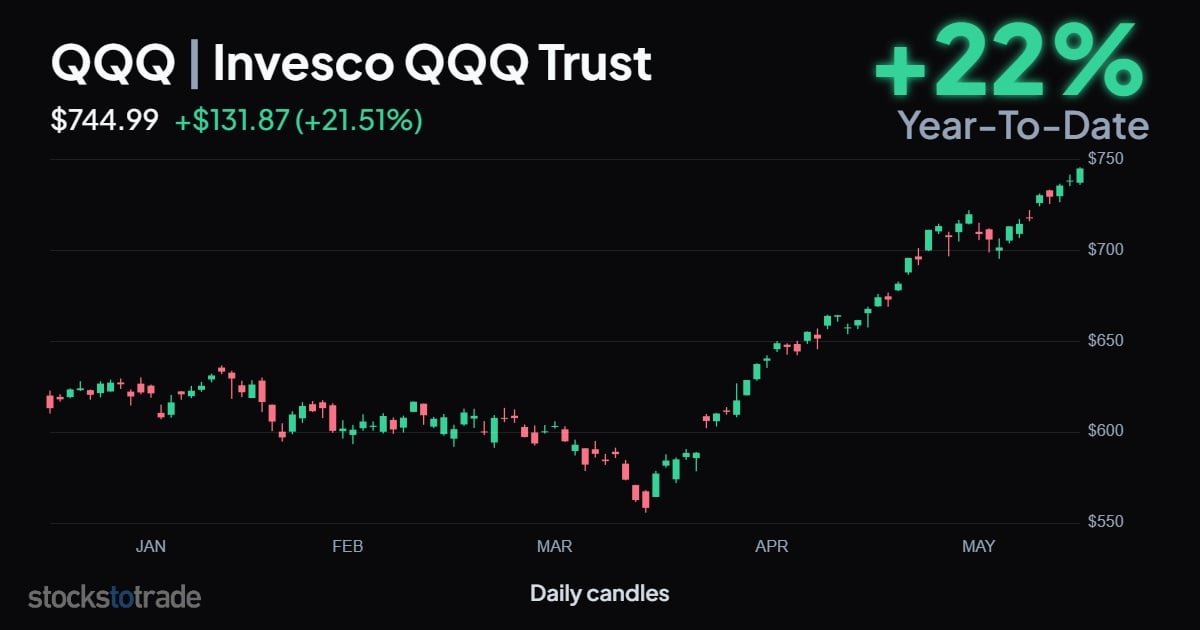
The Invesco QQQ Trust (NASDAQ: QQQ) is trading more than 10% above its 50-day moving average. The index is up 22% year-to-date. Every dip since April was bought up in seconds.
That’s a beautiful run.
It’s also stretched way beyond the normal levels…
This Bull Momentum Has My Attention
Pull up a daily chart of the QQQ.
The 50-day moving average sits around $656. And the ETF is currently trading near $745.
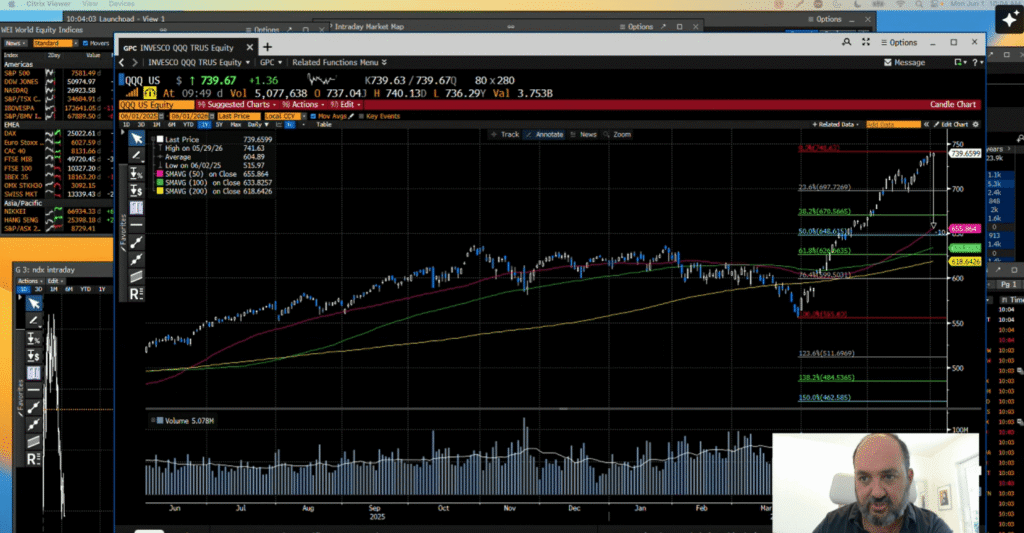
That’s a gap of more than 10% between the price and the trend line.
Stretched markets snap back. It’s just a matter of when and how far…
I’m not calling for a full collapse back to the 50-day moving average. I don’t need a move of that size to find gains.
The first real support sits at $700 per share. That’s a round psychological number, and it lines up with support from May.
A slide from the highs to $700 is only a 6% drop. It wouldn’t close the gap to the moving average, but that’s plenty of room for options trading gains.
Short-dated options contracts can spike exponentially when compared to the underlying percent change of the actual stock/index.
That’s the setup I’m watching.
But how do I know the pullback is coming…?
The Engine Is Overheating
The entire 2026 rally has one main engine: tech and tech-adjacent stocks.
From my scan on June 1, only two sectors are in green.
Energy and Information Technology:

For an example of this tech strength, the VanEck Semiconductor ETF (NASDAQ: SMH) is up 64% year-to-date. It’s the strongest corner of the entire market.
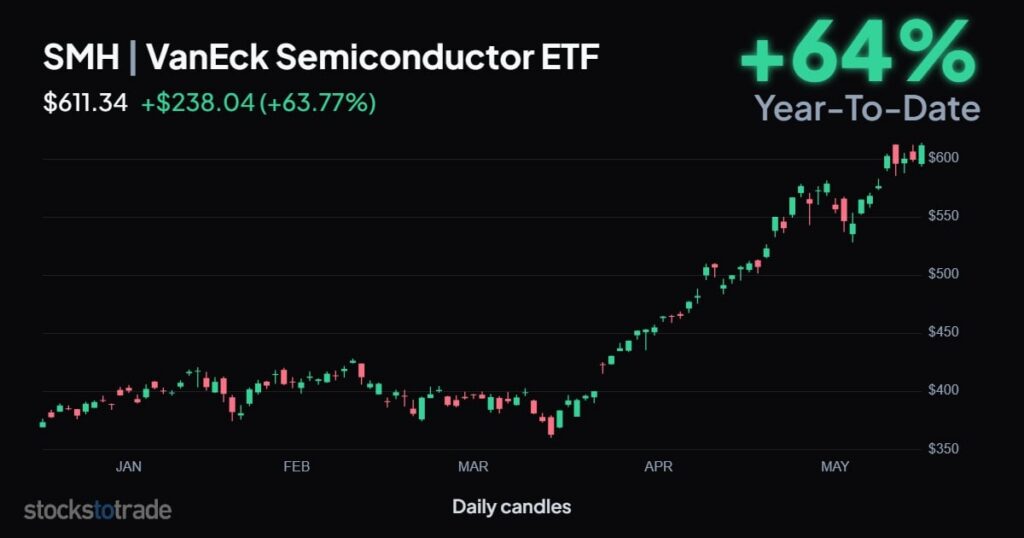
That’s the kind of strength I’d expect near the top…
The fund is trading roughly 150% above its 200-week moving average. That’s the most stretched it’s ever been. More stretched than the 2021 blowoff top.
NVIDIA Corporation (NASDAQ: NVDA) and the rest of the chip names are still pushing higher. But this trend is losing its runway…
Two sectors are holding up the entire market. And that sentiment can’t last forever.
The TACO Trade Exhaustion
Here’s the catalyst nobody wants to say out loud…
This market is being propped up by Trump’s on-again, off-again deal with Iran.
The war started on February 28, when the US and Israel struck Iran. Iran then choked off the Strait of Hormuz, which funnels roughly 20% of the world’s energy supply.
Then the dance began…
Trump sent threats, Iran retaliated, and the market started to sink. Then headlines touted an incoming peace deal, and the market pushed higher…
A true peace deal never came. Trump continued to posture, hoping he could prop up the market’s strength. And this has happened multiple times since the war began.
Traders have a name for this pattern: TACO. Trump Always Chickens Out.
He makes threats, the market dips, then he softens, and the market rips. Wall Street has been buying every dip on the assumption that Trump folds on bearish trajectories before anything truly breaks.
And it’s worked thus far, until it doesn’t…
That’s the whole market in a nutshell.
- Up on the hope of peace.
- Down on the reality of war.
I’m not predicting whether Trump signs the peace deal. I’m saying the market has already priced in the best possible outcome.
When everyone leans one way, the surprise comes from the other side.
The longer we go without a signed deal reopening the Hormuz, the sketchier this run becomes.
Even if a deal materializes, it’s likely already priced in, so the reaction would lead to a selloff either way.
My Trade Process
Learn this process, and you can reapply it on the next setup…
I build my positions around support and resistance.
That’s where the market shows its hand. A stock presses into resistance and stalls, or it loses a support floor like $700…
I’m not trading based on a hunch. I’m focusing on key levels that already exist in the market.
Then I set my stop loss, and I respect it.
A stop loss isn’t a suggestion. If the chart proves my thesis wrong, I’m gone. No ego. No averaging down into a broken idea.
But here’s the part that trips up traders…
You have to give the trade enough time to work.
Sometimes I’m in a position a few days before the move catches up to my thesis.
The setup is right, the timing was early, and my position flashes red before it ever flashes green.
The market doesn’t read my notes, it doesn’t care about my timeline. It does whatever it wants, whenever it wants.
My job isn’t to force the market to follow my thesis. My job is to figure out what the market wants to do… and ride that momentum once it commits.
There’s a science to trading this stretched market. It’s the same process I used to turn $5,000 into $493,000.
And in the last 5 weeks, I’ve used this strategy to uncover peak moves of:
- 383%
- 560%
- 823%
- All in less than 48 hours…*
I can walk you through the process from start to finish: Today at 1 P.M. EST.
The pullback is coming. The only question is whether you’re positioned for it.
Stay Street Smart,
Jeff Zananiri
*Past performance does not indicate future results, Not typical.