
One of my favorite trade setups just offered +100% gains.
I alerted this setup on Friday, July 17, and I’m already looking for the next trade.
The price action is simple.
I use the same patterns over and over again.
The key is to keep a regular eye on the market, so that we’re prepared when a stock falls into our trading trap.
Too many traders open their chart software and immediately make a trade.
Be realistic… What are the odds you find a perfect trade setup that’s ready for an entry right when you open your chart?
Pretty low.
We have to wait for specific price action. Look for this pattern…
Support and Resistance
Price action has a memory.
It reacts at the same spots over and over…
- a prior breakout
- the lows from a month ago
- the key whole dollars it’s traded between for weeks
A stock that extends too far in either direction acts like a rubber band pulled to its limit… and rubber bands snap back.
But when do they stop stretching? And where do they snap back to?
Support and resistance can give us the entire trade plan.
- Entry
- Goal exit
- Risk level
For example, if we’re going long on a stock, our entry is as close to support as possible, our goal exit is at a resistance level above our support, and our risk level is our initial support or just below it.
Traders who mark these levels on the chart are doing the math beforehand, so their emotions don’t get a vote once the trade is live.
Remember, you got to trade like a computer, like you’re dead inside.
My QQQ Trade
The Invesco QQQ Trust (NASDAQ: QQQ) handed us a textbook trade last week.
The QQQ peaked in early June near $745, then it rolled over into a string of lower highs.
By last Friday, July 17, it had bled lower for three straight sessions and slid right back down to the lows from June 9.
Those June 9 lows are a major support level. It showed the rubber band could be stretched to its limit, at least momentarily.
Here’s the alert I dropped on Friday:

I told the group I expected extreme selling in the first hour, and that’s exactly what I wanted. I was buying into the weakness, not chasing strength.
And the bounce came right off support.
By 11:55 that morning, the calls were up a couple hundred percent. I sent a sell alert to the group.

The snap-back off the June 9 lows was enough to send short-dated $695 calls into triple digits.
I’ve built my entire career on setups like this.
And anyone who held shares into Monday got the opportunity to sell even higher. Here’s a chart of the bounce that I traded:
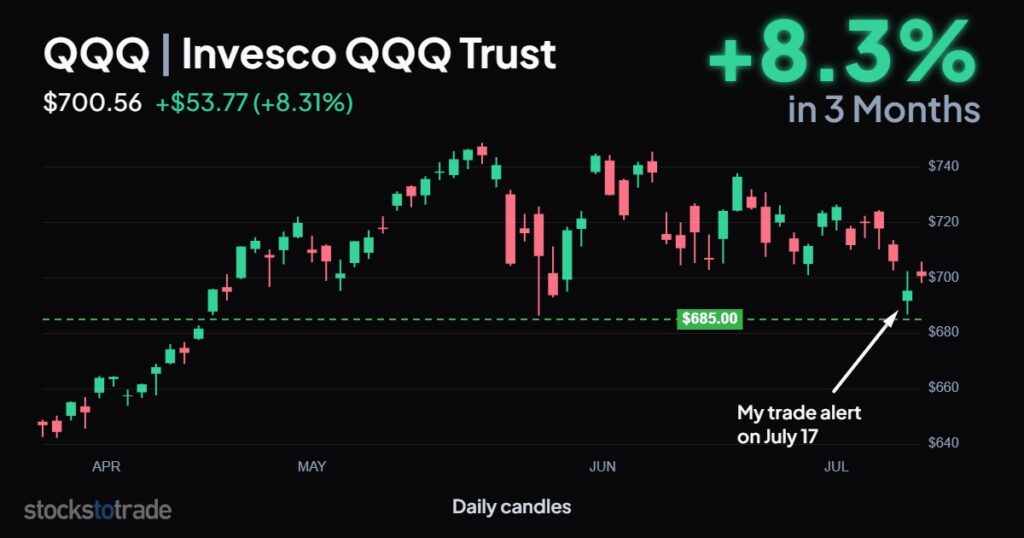

It doesn’t look like much on the chart, but for a short-dated contract, a change of a few percentage points is magnified exponentially.
Trade The Plan, Forget The Panic
Study this one.
The QQQ stretched too far from its consolidation, it tagged a key support level that I’d already marked, and it snapped back.
The support level gave me the entry + my risk level, and I was aiming for $715 resistance.
The QQQ didn’t hit $715 on Monday, but because of my entry, it didn’t matter, I was already in the green.
Anyone can find these setups.
The key is to wait for the stock to come to you. Otherwise you’re just gambling on random positions.
Build your plan before the trade, and stick to the plan.
Stay Street Smart,
Jeff Zananiri
*Past performance does not indicate future results, Not typical.