
Close all of your research tabs for CNN, CNBC, Cramer, The Motley Fool …
The fundamentals don’t matter anymore in the market.
On February 3, Advanced Micro Devices Inc. (NASDAQ: AMD) announced the biggest earnings beat since 2022.
Look what happened next, on the AMD chart below, every candle represents one trading day:
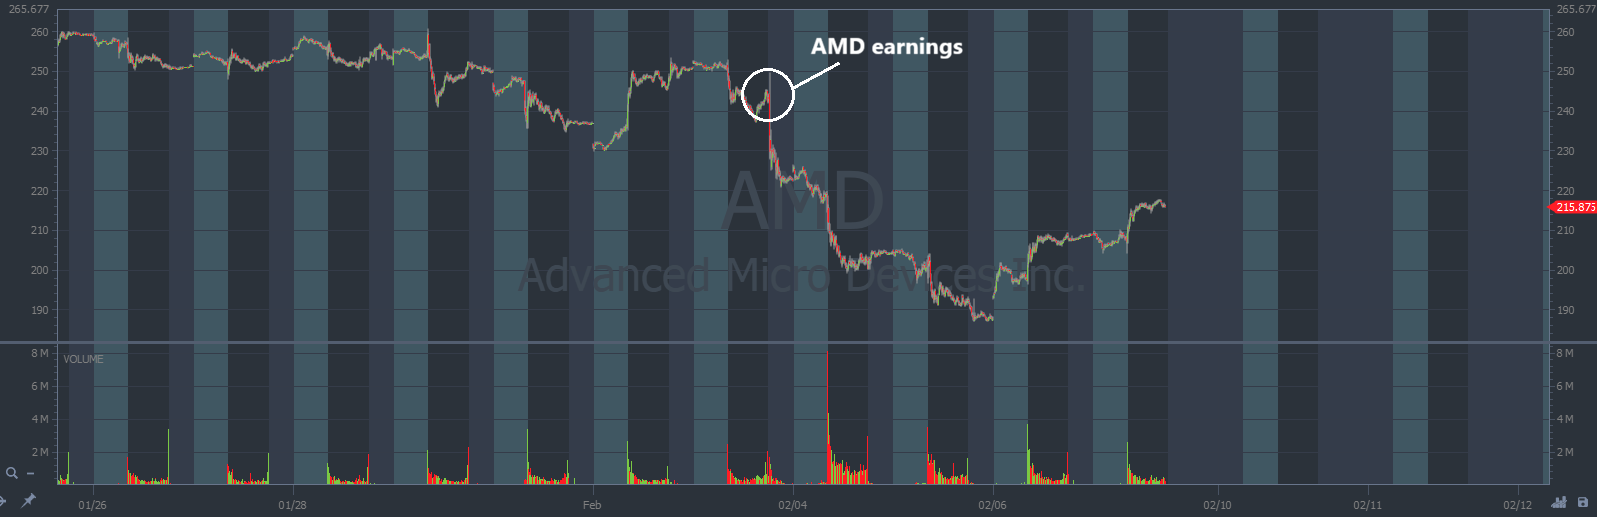
Stop wasting time with the fundamentals: The monthly revenues, the outstanding debt, the cash on hand …
Stocks are spiking and crashing on pure emotion right now.
Luckily, there’s a way to capitalize on this momentum.
When Emotions Are High
Investors are worried about the astronomical price tag that companies are paying for AI innovation in 2026.
Top tech firms are forecast to spend a combined $660 billion this year. And as a result, the fear of a bubble is intensifying.
Here’s where we find the silver lining:
Everything in the market happens for a reason. And most everything that happens can be measured.
For example, when emotions run high, whether stocks are spiking or falling, volatility is at a peak.
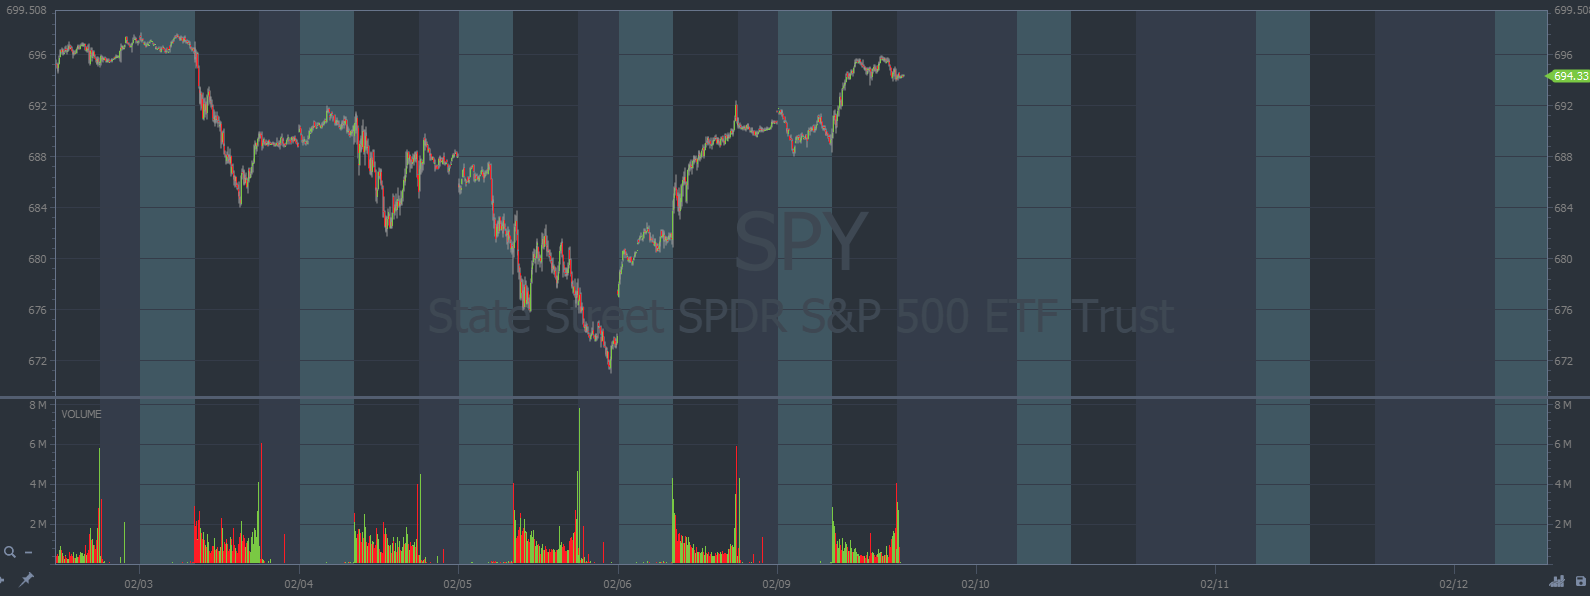
The Volatility Index (VIX) is designed to measure volatility in the market, specifically for the S&P 500 ETF Trust (NYSE: SPY).
Thus far, the VIX hasn’t spiked as much as I anticipated for the momentum we’re seeing in the market. But we’re still early.
On the SPY chart below, every candle represents five minutes:
On the chart below of the VIX, every candle represents one trading day
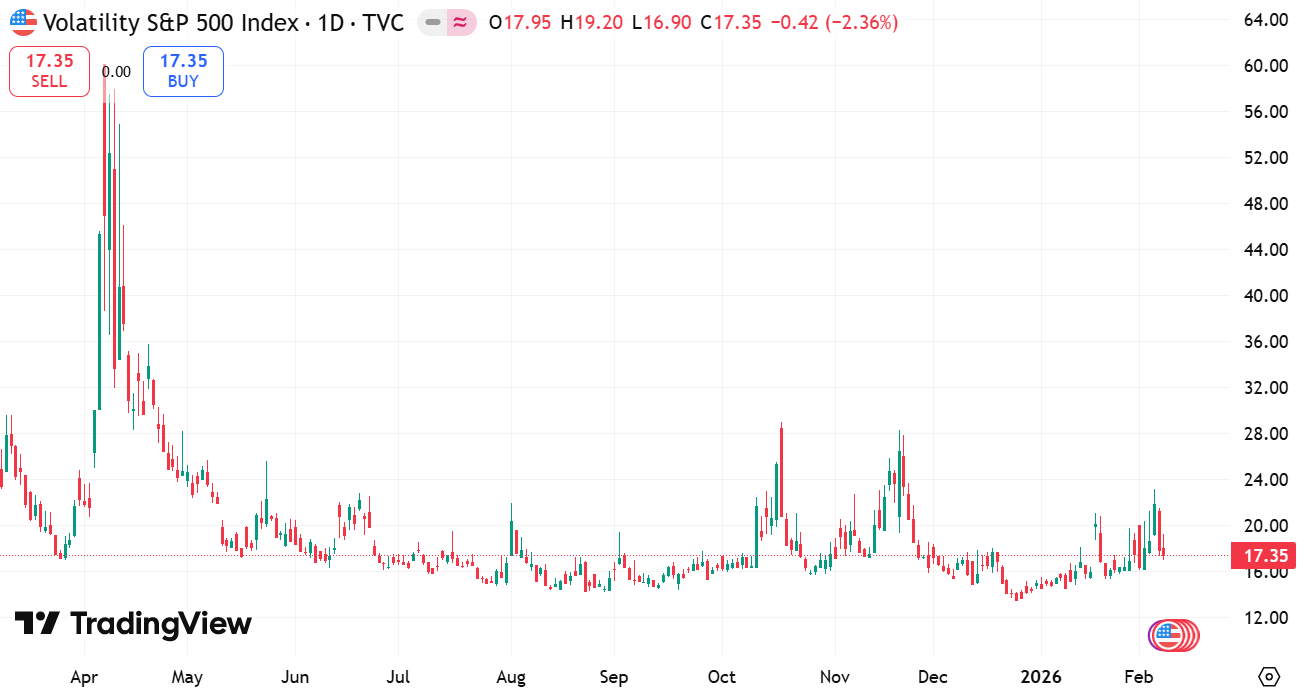
Notice, the VIX spiked last week during the volatility, but it still was comparatively low. And then it quickly pulled back.
I think it’s going to rebound in February.
- We already saw the beginnings of bearish volatility from big-tech stocks as bubble fears have circulated for months.
- February is the second worst month for stocks.
- We’re nearing the end of earnings season, so there aren’t any more catalysts to push prices higher.
This is the play I’m watching most closely.

Bonus Pick
I’m also looking for Put options contracts on any crypto plays.
Bitcoin was another casualty of the market’s recent weakness. The price broke below $80k support in late January and kept going lower.
On the Bitcoin chart below, every candle represents one trading week
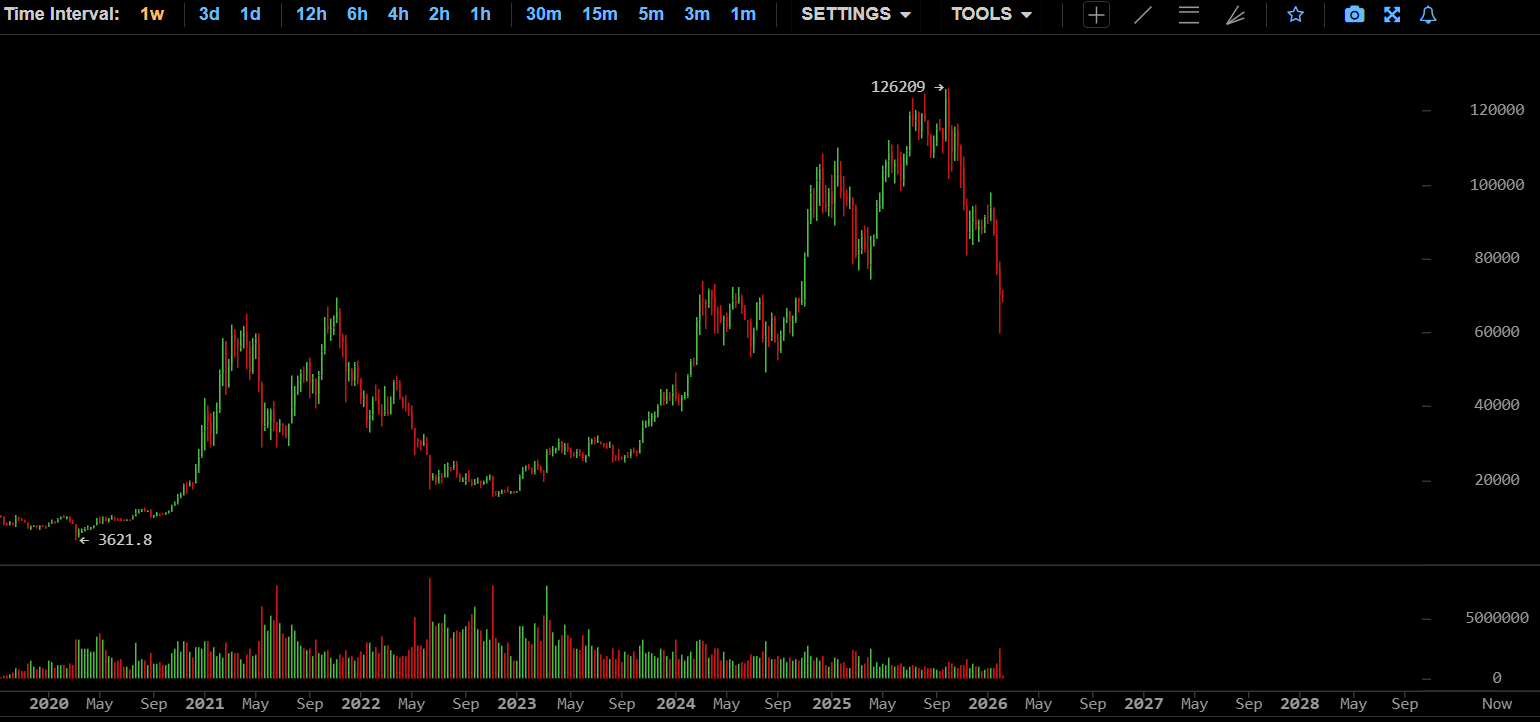
In the long term, Bitcoin could definitely surge back to the highs.
But from a small-account trading perspective, I think it could touch $40k before a true reversal to the upside.
Read: How The Market is Rigged in Your Favor.
Keep your head on a swivel in February. Remember, it’s the second worst month for stocks.
We can trade this bearish momentum with Put contracts. Just make sure to respect your risk levels.
Stay Street Smart,
Jeff Zananiri
*Past performance does not indicate future results, Not typical.