Somebody just bet almost $370,000 that a $2 stock will spike higher into the end of October…
These new orders drastically increase the option’s open interest (the number of contracts being held in accounts).
It’s unusually large trading volume… Somebody’s betting big.

One of the best ways to find trade setups: follow the big money.
Options-flow scanners show us large orders on specific stocks.
When a big order corresponds with a chart that matches my pattern, we’ve got two factors to support our trade.
- Someone else has a lot of money behind the setup (strength in numbers).
- The chart shows us a most-likely move.
Everything’s lining up. Let’s look for an entry…
Options-Flow Scanner
Every options trade leaves a footprint. An options-flow scanner tracks those footprints in real time and flags the ones that stand out.
Here’s what it looks for:
Size. Most retail traders buy a handful of contracts. When someone drops $174,000 on a single order of 6,000 contracts (that was one of the biggest orders on my newest watchlist stock), that’s not a hobbyist. We’re dealing with an entirely different kind of trader…
Volume vs. open interest. Open interest is the number of contracts already out there. For example, if today’s volume is 7x the open interest, most of those contracts are brand new. Someone is opening a fresh position, and it’s a BIG one.
Clusters. One big order could be a fluke. Several big orders on the same stock, all of them calls, within an hour? That’s not a random one-off trade…
Why do we care?
Big orders often come from funds and institutions with research teams who might have a better read on what’s coming.
One warning: the scanner shows us the orders, not the intent.
A big call purchase could be a hedge against a short position, or one leg of a more complex trade. Never follow the money blindly.
That’s where the chart comes into play…
An attractive chart + big orders = a promising trade setup
My #1 Watch
On October 6, I noticed several big orders on Hertz Global Holdings, Inc. (NASDAQ: HTZ).
Here’s the alert I sent to traders:
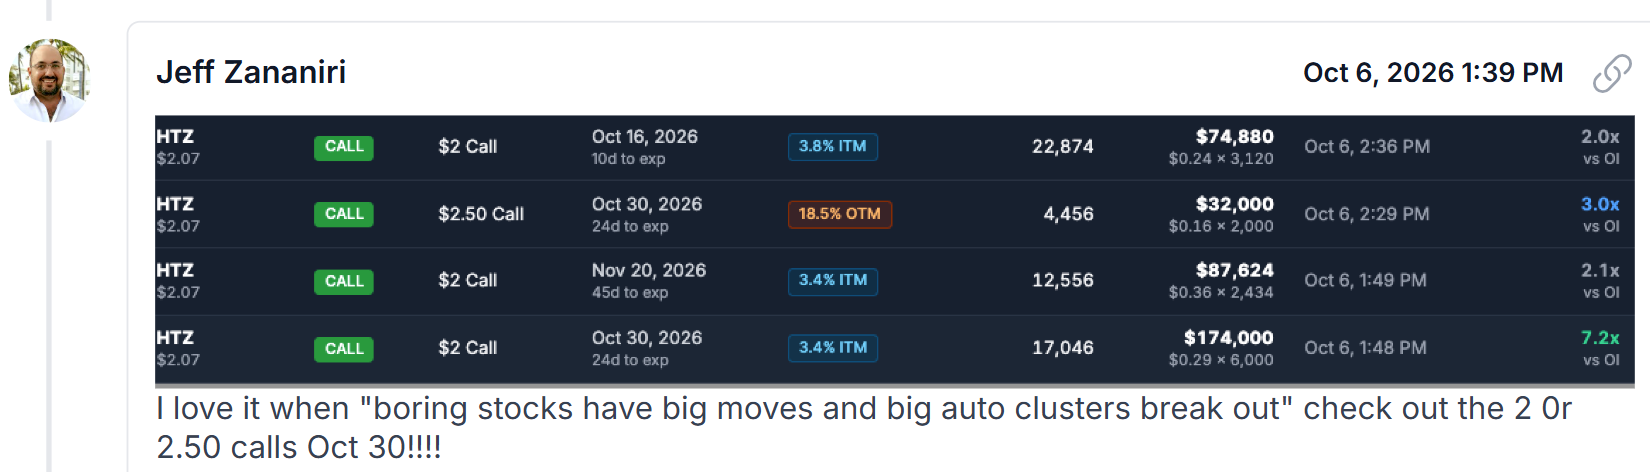
Specifically, the October 30 calls caught my attention.
The scanner shows $32,000 in $2.50 calls (3x the open interest) and $174,000 in $2 calls (7.2x the open interest).
Those are huge orders.
Along with the other two call contracts, someone (or multiple people) bought a total of $368,504 in call contracts on October 6.
That’s a lot of money riding on a $2 stock…
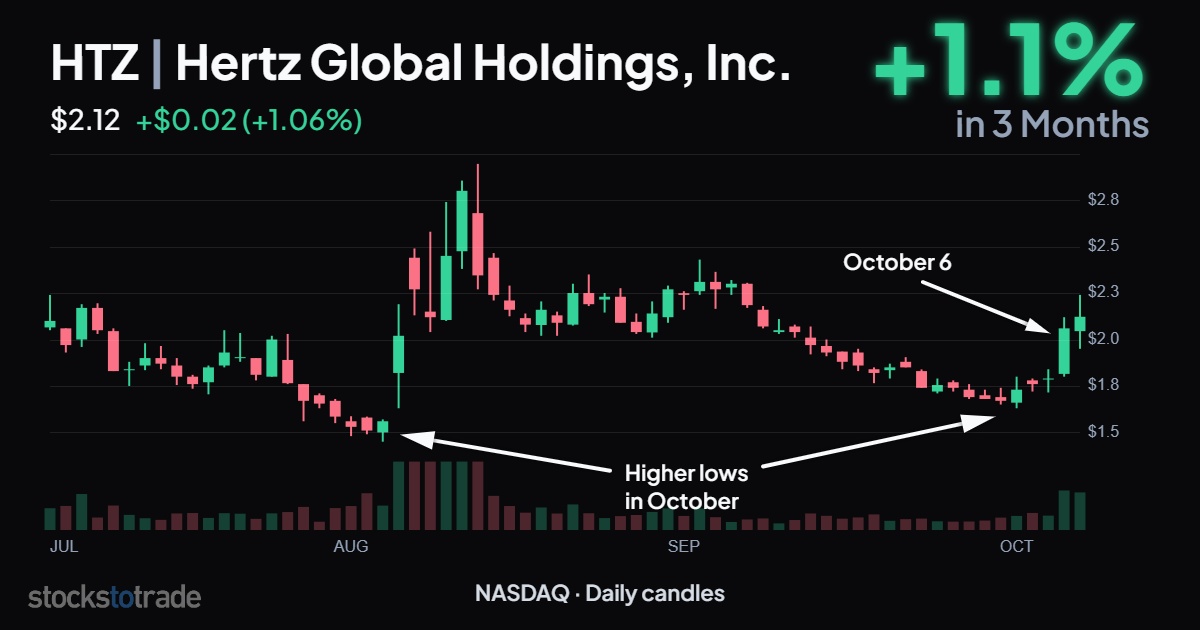
Plus, the chart just started to rally off higher lows:
Hertz is already pushing higher, and the intraday price action shows strong support at $2.
That could be an excellent place to build a position. And we can use it as a risk level in case the stock decides not to spike any higher.
Nothing in the market is a guarantee. Only risk as much money as you can afford to lose.
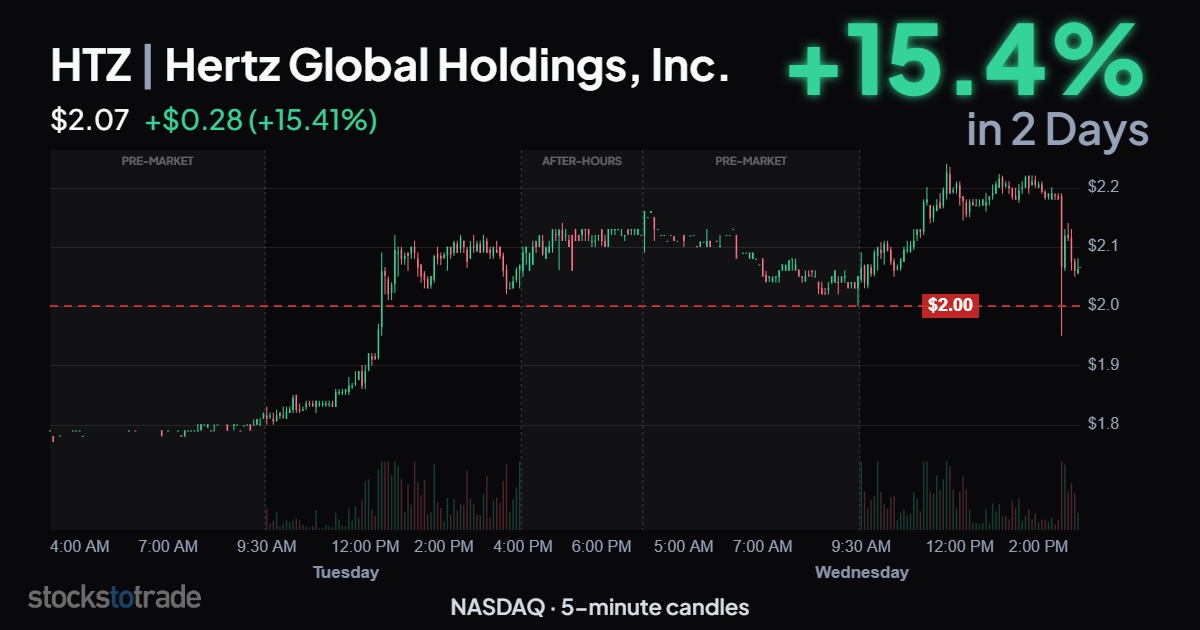
If this stock is still consolidating above $2, you’ve got a trade.
Otherwise, open your options-flow scanner and get ready for the next setup.
Institutions are always throwing around large amounts of cash. There’s another trade to make right around the corner…
How I find my next trade setup.
Stay Street Smart,
Jeff Zananiri