Silver just gave us one of the ugliest moves since 1980.
And the volatility isn’t over yet …
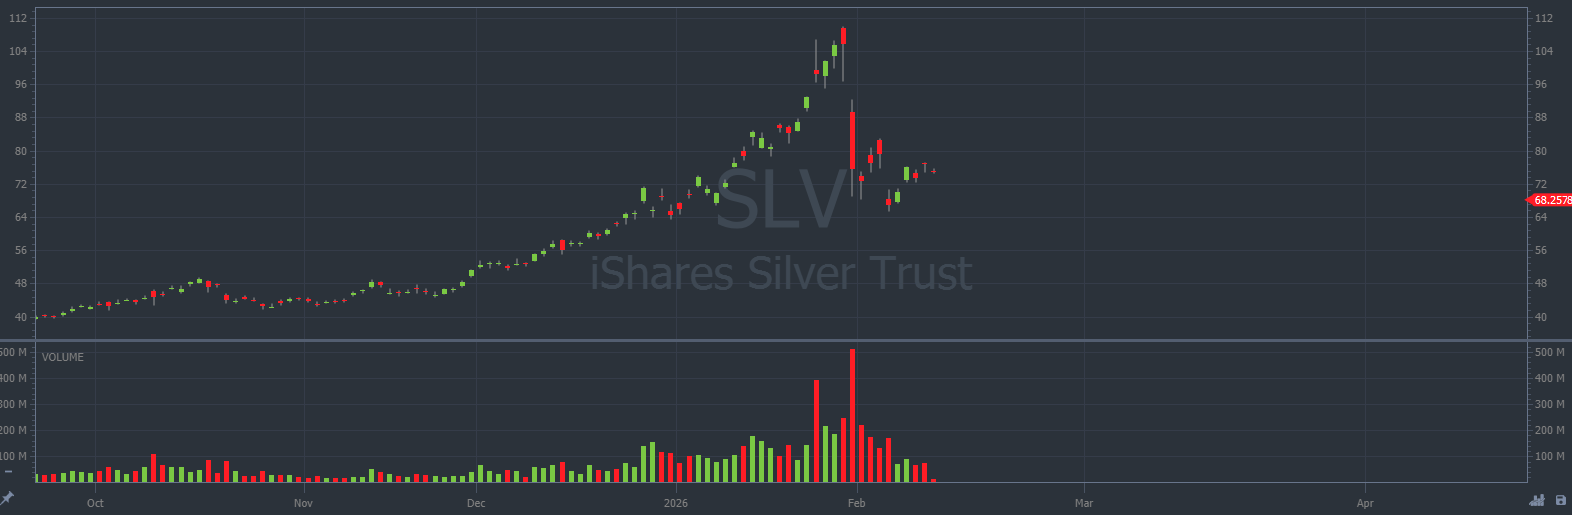
The iShares Silver Trust (NYSE: SLV) surged 170%* in 2025. It tacked on another 70% in the first few weeks of 2026. Then cratered 34% in a single session on January 30.
Read: Where Does Silver Go From Here?
Everyone’s scrambling for answers right now. “Where should my money go now?”
And here’s what most traders miss: Money doesn’t disappear from the market. It moves.
That’s how I found my most recent setup.
Similar sectors move in tandem, sometimes a couple steps apart. And that lag creates one-sided setups that are easy to target if you’re watching the right levels.
I already called a perfect trade on a key stock in this sector.
And I’m not done …
Sector Momentum
Freeport-McMoRan Inc. (NYSE: FCX) is showing us almost the exact same pattern right now.
FCX hit an all-time high of $69.44 on January 29, rode copper prices to record levels above $6.11 per pound, then dropped alongside SLV when the precious metals sector imploded on January 30.
But here’s the key difference: FCX bounced higher.
On the SLV chart below, every candle represents one trading day:
On the FCX chart below, every candle represents one trading day:
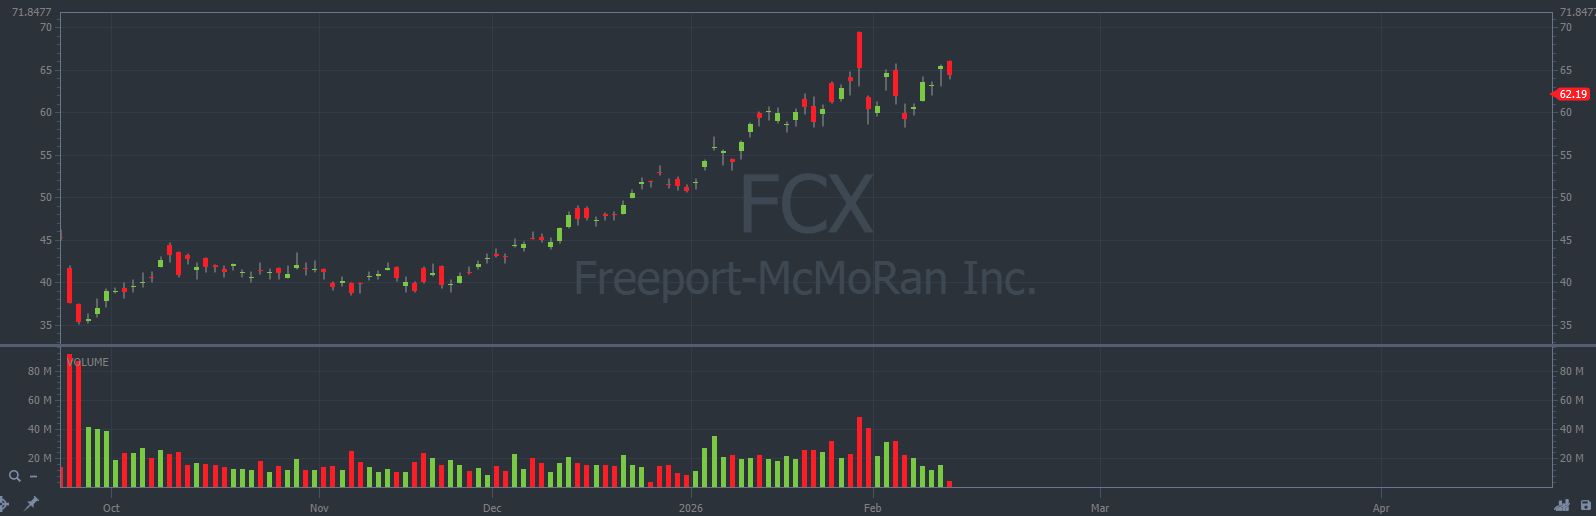
After the late January selloff, FCX consolidated around $60 instead of falling further.
The stock recovered from the dip and started moving toward recent highs.
Judging by the recent bearish momentum in the precious metals sector as a whole, I theorized we could target FCX for some Put trades.
When stocks bounce this aggressively after a sector-wide selloff, they’re prime candidates for pullbacks. The price action is stretched, sentiment is conflicted, and the tape gives us clear setups.
How I’m Playing FCX
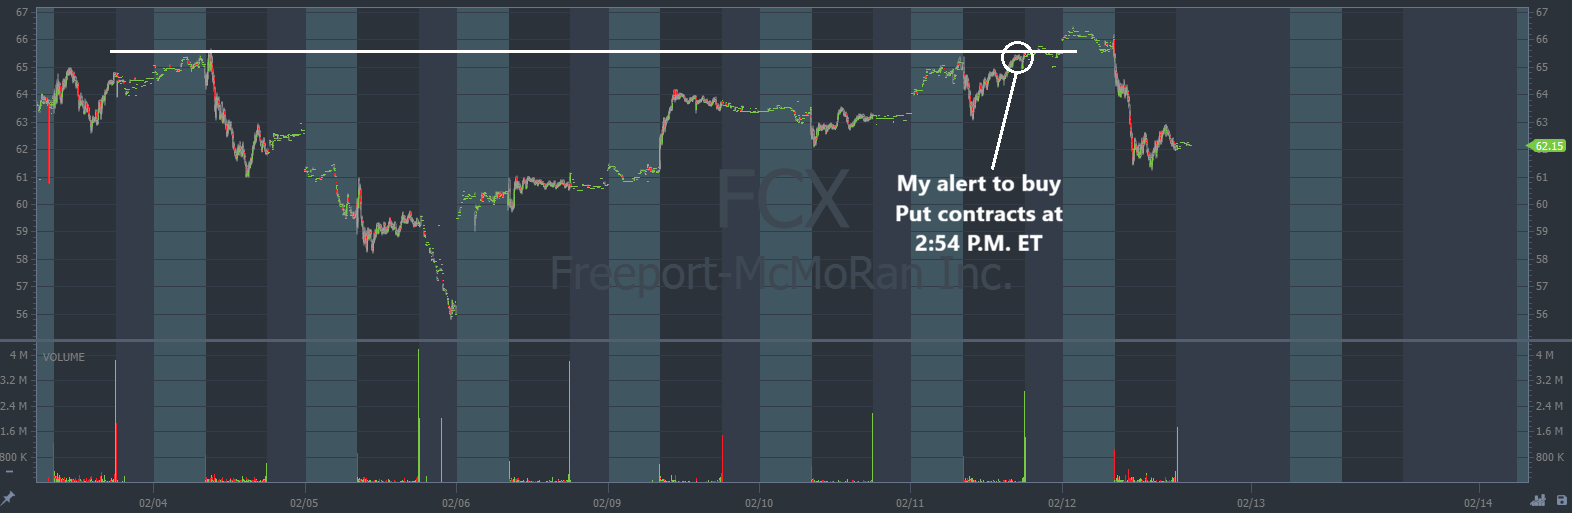
On February 11, the stock pushed against resistance from the bounce a few days ago, on February 4.
The price tested that level in the morning, then it rallied in the afternoon and tested it again to no avail.
I sent out the following trade alert at 2:54 P.M. Eastern:
Here’s my alert overlaid on an intraday chart.
Every candle represents one trading minute:
This isn’t rocket science.
A lot of people make options trading more difficult than it needs to be.
Attend the Options Trading Bootcamp on February 17 and 18.
It’s crazy how a two-day virtual conference can literally change your entire life trajectory.
Stay Street Smart,
Jeff Zananiri
*Past performance does not indicate future results, Not typical.