You’re not imagining it. This market is chaotic…
- A trillion-dollar IPO.
- A war in the Middle East.
- Inflation at three-year highs.
But even the most seemingly unpredictable market swings follow logical patterns.
I keep coming back to this 1 ticker…

When this many catalysts hit at once, the headlines fly faster than people can keep up, and traders get chopped to pieces trying to predict the next move.
But there’s one asset that gives us volatility AND logical price action.
I’ve spent 25 years trading manias like the one in front of us. In a tape this violent, I want an asset that’s built to move and built to follow my patterns while it does.
It’s my favorite ticker in the market…
The Catalysts Are Stacking Up
Let’s start with the obvious one.
SpaceX went public today on the Nasdaq (under the ticker SPCX).
It had an initial pricing of $135 per share, raising roughly $75 billion at a $1.77 trillion valuation. That’s the largest IPO in market history.
The entire market is going to fixate on this one stock, and when the market fixates, volatility spreads to every other corner.
Here’s the part traders are missing. About 15 days after listing, SPCX is set to enter the Nasdaq-100, forcing every QQQ fund on earth to buy billions in shares.
That’s a massive market rotation.
Then there’s the war.
The U.S. and Iran are sitting on a shaky ceasefire that’s already been violated. It was a 60-day memorandum that negotiators mostly agreed to, but one Trump still hasn’t signed.
Strikes keep flaring near the Strait of Hormuz, the chokepoint for roughly a fifth of the world’s seaborne oil. Brent is hanging in the low $90s, and every bad headline out of the Gulf sends it ripping.
That energy risk is already showing up in the data.
May CPI was announced this week at 4.2% year over year. That’s the hottest inflation reading since 2023. Energy drove more than 60% of the monthly jump.
And the man who has to deal with it is brand new to the chair…
Kevin Warsh was sworn in as Fed chair on May 22, and he runs his first meeting June 16 and 17.
The futures market is pricing virtually no chance of an interest rate cut, and rate-hike odds are creeping back in for the first time in years. The Fed committee dissented four ways in April, the most split it’s been since 1992.
Every one of these catalysts introduces volatility to the market. And altogether, they make for the most momentous environments in years.
How can we possibly trade in a market this ripe with volatility?
Meet My Favorite Index
The iShares Russell 2000 ETF (NYSE: IWM).
It’s a small-cap index with 2,000 names instead of a handful of mega-caps. And that’s exactly why I like it right now.
Small-caps make larger price swings. And more movement in the underlying assets means bigger percentage moves on the options.
A clean 1–2% day in the IWM can turn into a triple-digit move on the right short-dated contract.
But it isn’t a wild card. Spread across 2,000 stocks, the IWM doesn’t live or die on one earnings report. It moves on patterns I can read and overall market momentum.
That diversification matters more than usual this summer.
The SPY and the QQQ are top-heavy with large-cap tech. One semiconductor miss tanks the whole index. That’s exactly what happened on June 5, when a tech earnings shock dragged everything down with it.
The QQQ carries that concentration risk every single day. And with SpaceX about to pull even more money toward the Nasdaq giants, that top-heavy setup gets more lopsided, not less.
The IWM doesn’t have that problem. There aren’t mega-cap stocks to sink it on a bad print.
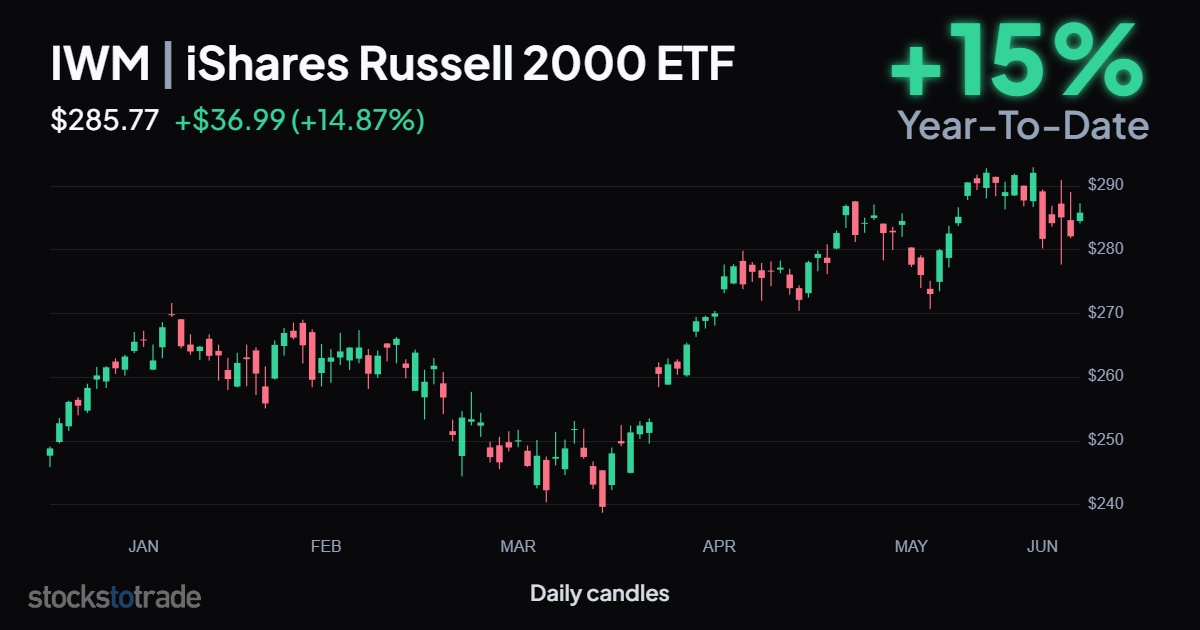
Look at the levels on the chart above.
- $290 is the ceiling, the high from late May, and prices keep stalling just under it.
- $280 is the first floor, the breakout level from April’s highs that buyers have defended on every pullback since.
- Below that, $270 is the biggest support level. Lose it, and the upward trend comes into question.
Right now, the IWM is pinned in a tight box between $280 and $290. When it breaks, it’ll break hard. That’s the move I’m watching.
Let the Stats Be Your Guide
History tells us what to expect. So I pulled the numbers on the IWM this year.
Of the last 50 sessions, 32 were up days and 18 were down. A clear bullish tilt.
The average up day ran +0.95%, the average down day was −1.05%. The medians sit tighter: +0.65% up, −0.74% down.
The big green days came on catalysts. March 31 popped 3.50% on quarter-end, April 8 ran 2.99% on the ceasefire bounce, May 20 jumped 2.52% on debt-ceiling relief.
The red ones clustered: June 5 dropped about 3.5% on that tech shock, May 15 fell 2.41%, and March 20 lost 2.18%.
Down days bunch up. Up days spread out and stack.
Here’s how we can use that information today…
Let the stats guide your entry, not your gut.
The traders who get hurt in a tape like this force a direction and marry it.
I don’t. I read the levels, I respect the stats, and I let the chart tell me which way it wants to break and how far it might move.
Four catalysts are hitting a market that’s already on edge. The volatility is coming whether you’re ready or not.
The IWM is my solution to survive this volatility AND pull gains from it.
Stay Street Smart,
Jeff Zananiri
*Past performance does not indicate future results, Not typical.