
We’re witnessing one of the biggest market opportunities since 2020.
And most traders won’t see it coming until it’s too late.
Yes, broad indexes look steady right now …
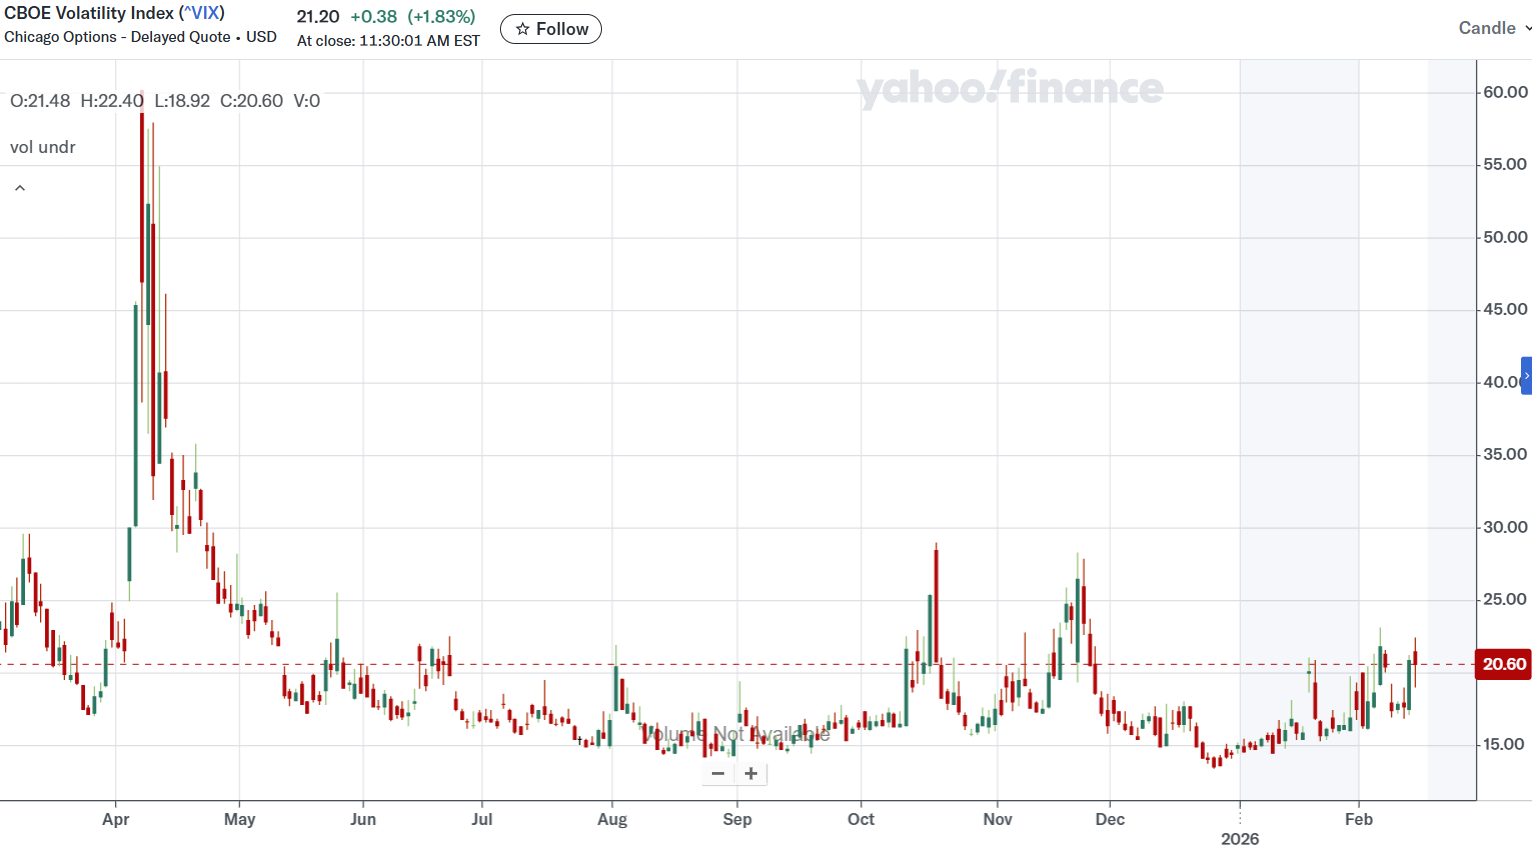
- The CBOE Volatility Index (VIX) sits around 20, up from its recent lows but not by much.
- The S&P 500 ETF Trust (NYSE: SPY) is grinding sideways near the highs.
But beneath the surface, individual stocks are exploding in both directions.
This is the exact environment that made fortunes in 2020. It literally minted millionaires left and right. And it’s happening again right now.*
Don’t let lazy consolidation on the SPY lull you into a false sense of security. There are giants moving beneath the surface.
It looks like a calm day for fishing … But megalodon-sized moves are ready to bite my hook.
What The Data Shows
All of this data points toward an explosive trade setup …
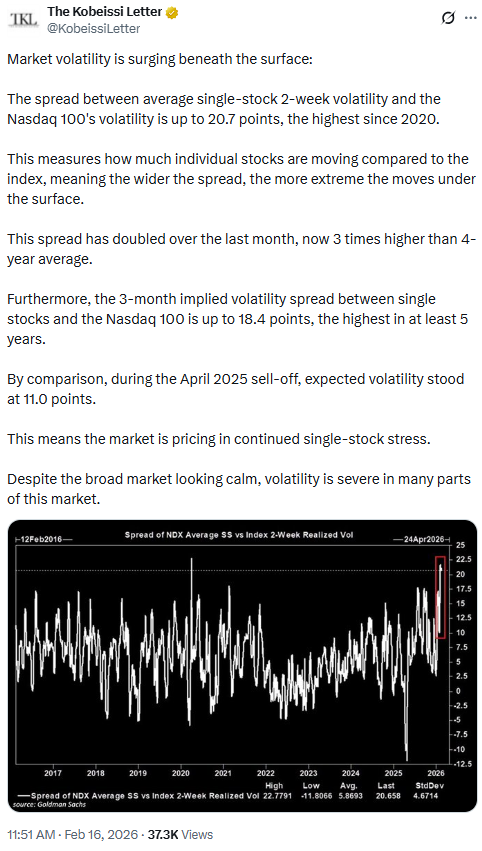
The spread between average single-stock 2-week volatility and the Nasdaq 100’s volatility just hit 20.7 points.
That’s the highest level since March of 2020.
This spread has doubled over the last month and is now 3 times higher than the 4-year average.
Another important data point: The 3-month implied volatility spread between single stocks and the Nasdaq 100 reached 18.4 points, the highest in at least 5 years. During the April 2025 sell-off (from Trump’s tariffs) that had everyone panicking, this spread was only 11.0 points.
To translate, individual stocks are moving violently while major indexes barely budge.
This Twitter post is stuck in my brain right now:
The Opportunity For Traders
February is historically the second worst month for stocks.
We spoke about this idea in this blog post.
There are already signs of a market pullback and weakness among major tech stocks this February. And that volatility could increase into the end of the month and the beginning of March.
As a result, I’m watching the VIX for bullish trade setups.
I expect the VIX to spike due to the volatility among individual stocks. It should seep into major indexes eventually.
Right now, the VIX doesn’t begin to rival its levels from the April Trump-tariff scare or the 2020 COVID panic, and yet some of the market data paints a more volatile picture.
During the tariff scare in April 2025, the VIX hit 60. In 2020, during the pandemic crash, the VIX spiked to 82.
It’s only at 20 right now.
On the VIX chart below, every candle represents one trading day:
Right now in the market, we’re seeing extreme volatility in individual stocks without the VIX explosion … yet.
Some stocks are up 40%, 100%, even 200%. Others are getting crushed by 30% or more.
And because these moves offset each other, the indexes stay relatively calm.
But this perfect balance is unlikely to last.
And I’m ready to make a trade when the VIX starts to surge.
Stay Street Smart,
Jeff Zananiri
*Past performance does not indicate future results, Not typical.