The entire market held its breath last night…
NVIDIA Corporation (NASDAQ: NVDA) just dropped Q1 earnings after the close on May 20. And this morning’s tape will tell us where the AI sector goes next.
NVDA is the most-watched company in the world. Wall Street fat cats and retail traders alike hang on Jensen Huang’s every word:

When one company carries this much weight in the indices, the post-earnings reaction sets the tone for weeks.
The chip stocks that reported ahead of NVDA already gave us a hint about possible price action…
It’s up to us to follow the playbook.
Tech Earnings This Year
Three chip names dropped earnings before NVDA.
Each one gave us a clean template for how to read the market’s reaction the rest of this week…
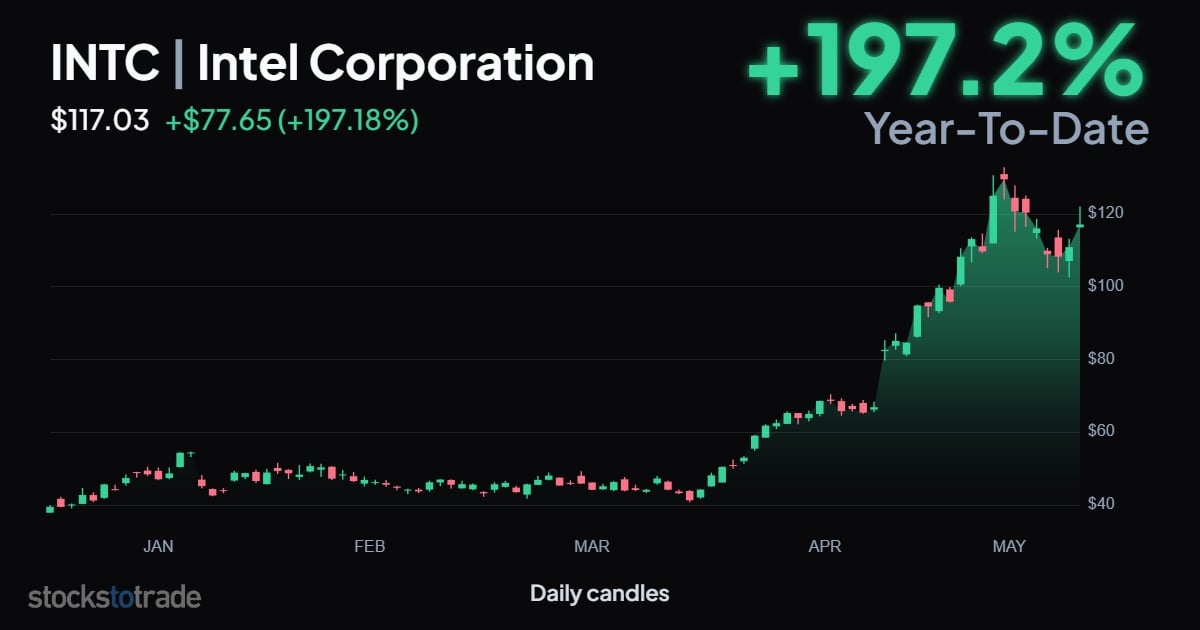
Intel Corporation (NASDAQ: INTC) reported after the close on April 23.
Revenue hit $13.6 billion versus the $12.32 billion Wall Street consensus. Non-GAAP EPS came in at $0.29 against a $0.01 estimate.
The stock ripped 15% in after-hours trading that evening and never looked back.
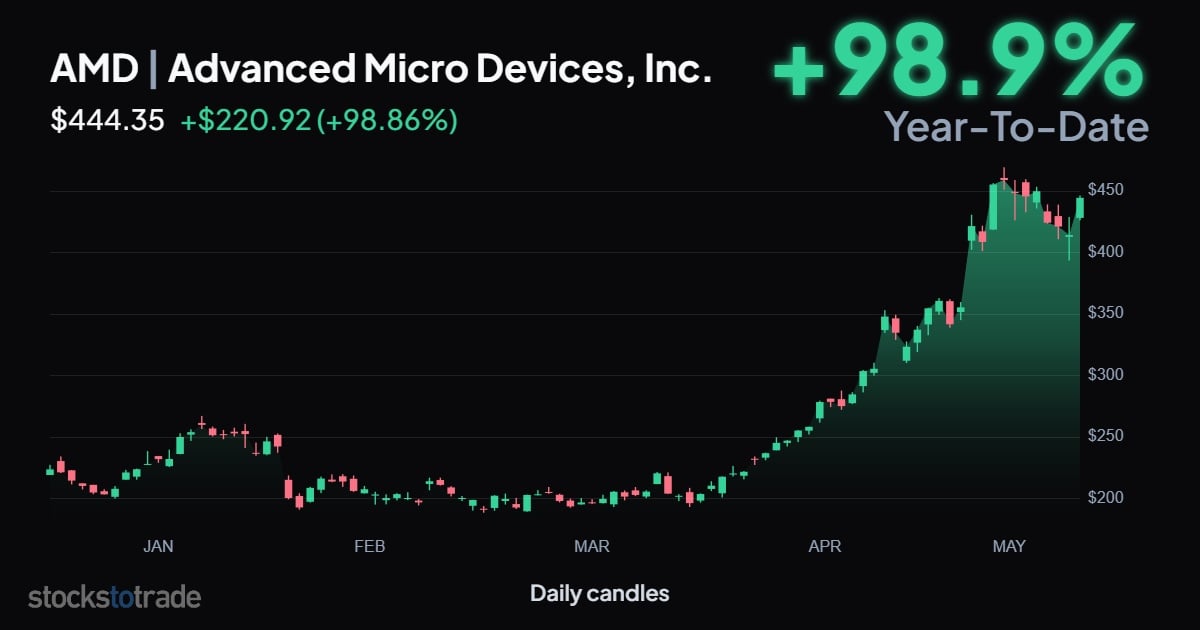
Advanced Micro Devices Inc. (NASDAQ: AMD) reported on May 5, after the close.
Revenue printed $10.3 billion versus $9.84 billion expected. Non-GAAP EPS hit $1.37 against the $1.29 consensus.
Data center revenue alone surged 57% year-over-year to $5.8 billion. The stock tagged a fresh all-time high after the announcement.
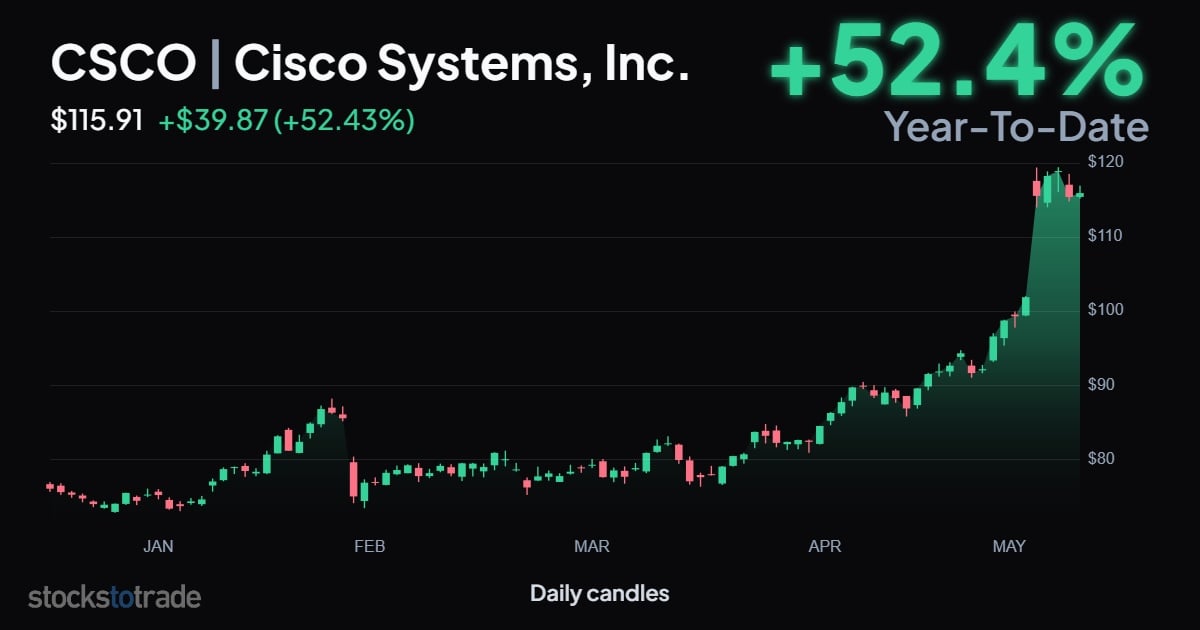
Cisco Systems Inc. (NASDAQ: CSCO) followed on May 13, after the close.
Revenue at $15.84 billion beat the $15.56 billion estimate. AI infrastructure order guidance jumped from $5 billion to $9 billion for fiscal 2026.
CSCO gapped from around $101 to over $116 the next morning, a 15% overnight move on an established large-cap.
Three for three.
Each of these earnings announcements confirmed the same thesis: AI infrastructure spending isn’t slowing down.
And yesterday it was NVDA’s turn…
Why NVDA Matters More Than the Rest
NVDA’s results are THE data point in the AI sector.
The stock represents nearly 8% of the SPY and over 9% of the QQQ. No other name carries that kind of weight.
When NVDA announces earnings, fund managers reset their entire AI exposure across dozens of correlated names.
The company went into the earnings announcement with consensus expectations of $1.76 EPS on $78.75 billion in revenue.
The data center segment alone was projected to bring in $72.85 billion, up from $39.11 billion in the same quarter last year.
Heading into the announcement, NVDA traded around $225 per share on a pullback after making new all-time highs:
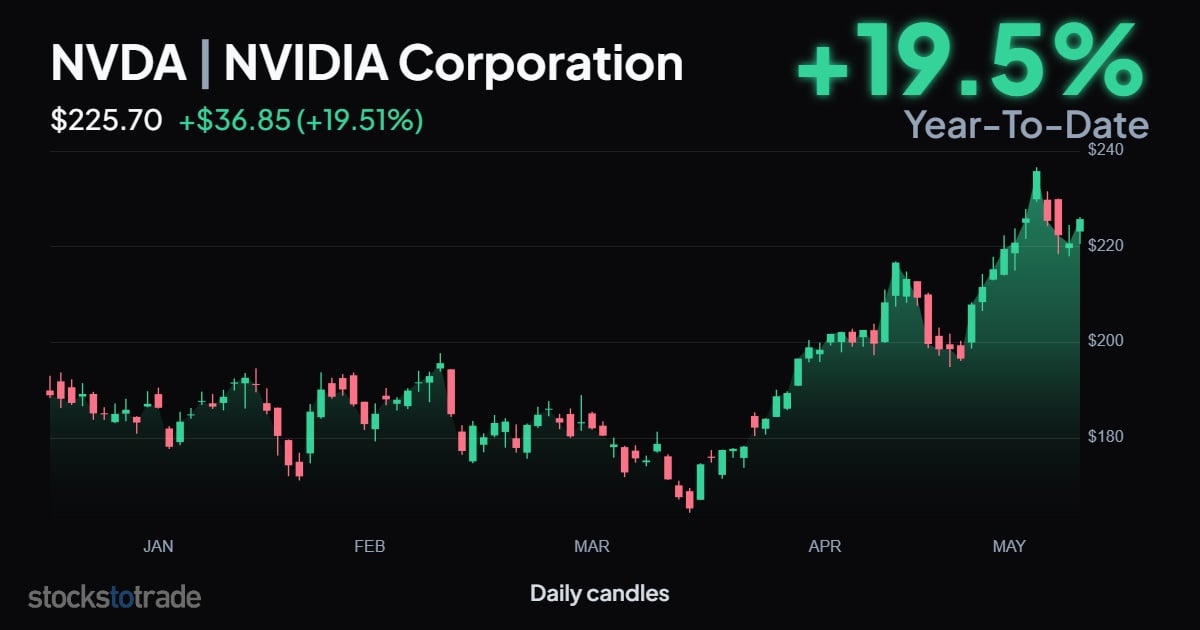
Compare that to: INTC up 197% YTD, AMD up 99% YTD, and CSCO up 52% YTD.
Pre-earnings price action, NVDA stock has underperformed its chip peers this year…
Three Ways to Trade This Morning
This is the framework I’m using regardless of how NVDA opens:
Strategy 1: Trade the immediate reaction.
Whether NVDA gaps up or gaps down, the first 30 minutes (after the opens at 9:30 A.M.) will be the most violent.
Let the chart find its footing, mark key levels, and look for the next move.
Strategy 2: Trade the sympathy plays.
When NVDA shows volatility, the entire chip space moves with it. AMD, INTC, Broadcom Inc. (NASDAQ: AVGO), and Taiwan Semiconductor Manufacturing Company (NYSE: TSM) all react to NVDA’s data.
Sometimes the cleanest setups appear on the sympathy names after NVDA exhausts its initial move.
Strategy 3: Trade the indexes.
NVDA represents nearly 8% of the SPY. A big move in NVDA drags the S&P 500 ETF Trust (NYSE: SPY) and the Invesco QQQ Trust (NASDAQ: QQQ) right along with it.
Trading options on the broader indices can be cleaner than picking the exact right name in the market.
The Levels I’m Watching
Before the open this morning, here’s my chart prep on NVDA:
- The pre-earnings high just under $240. That’s the first ceiling.
- The $220 round-number support that held during the May pullback.
- The April breakout level near $200, which would mark a major failure if it gives way.
If NVDA gaps above $240 and holds, the breakout continuation trade is live. If NVDA gaps below $220 and can’t reclaim it, the gravity trade kicks in.
The chart will tell us which direction it wants to go within the first hour.
Stay Street Smart,
Jeff Zananiri
*Past performance does not indicate future results, Not typical.