I just sent another trade alert for another winner…
Are you paying attention?
This pattern repeats.
It was the same simple pattern, on a stock that everyone’s heard of…
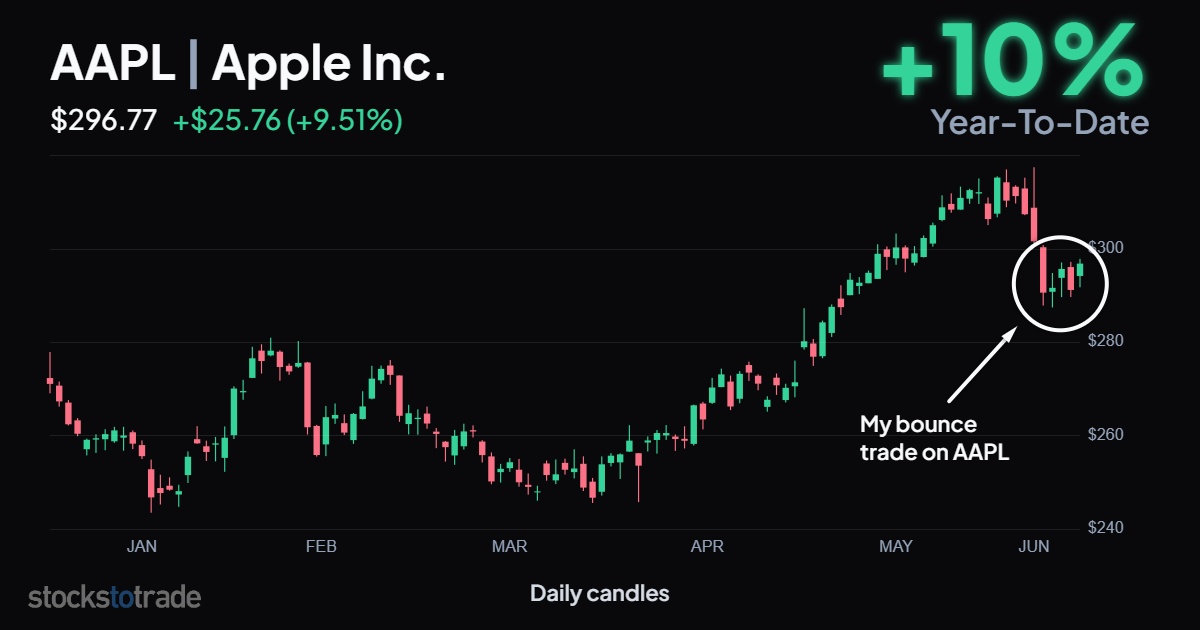
Apple Inc. (NASDAQ: AAPL)
And it won’t be the last time we see a setup like this.
Once you learn to spot it, you start seeing it everywhere. Get ready for the next one!
Stocks Don’t Fall Forever
Stocks don’t move in one direction indefinitely.
It doesn’t matter if it’s a trillion-dollar tech giant, a beaten-down retailer, or a penny stock ripping on no news at all.
- A stock that rips higher eventually runs out of buyers.
- A stock that bleeds lower eventually runs out of sellers.
I’m not in the business of guessing tops and bottoms on a hunch. I hunt the moment a crowded trade stretches so far in one direction that the snapback becomes the highest-probability move.
When it’s up too far, I look for the drop. When it’s down too far, I look for the bounce.
Either way, I’m trading the change in direction.
A few days ago, Ford Motor Company (NYSE: F) was stretched too high, so I bought puts and rode it back down.
This week, Apple was stretched too far to the upside. It was the same pattern, in an opposite direction.
The RSI Was Screaming
How did I know AAPL was stretched too far?
The Relative Strength Index (RSI).
The RSI measures momentum on a scale of 0 to 100. The lower the number, the greater the odds of a bounce. The higher the number, the greater the odds of a pullback.
By June 9, Apple’s RSI had dropped under 30, falling near 25. That’s a big-cap stalwart stock flashing deep into oversold territory. And it tells me one thing: the selling is exhausted, a bounce is coming.
So I sent the alert. Buy the June 15 $300 Calls.
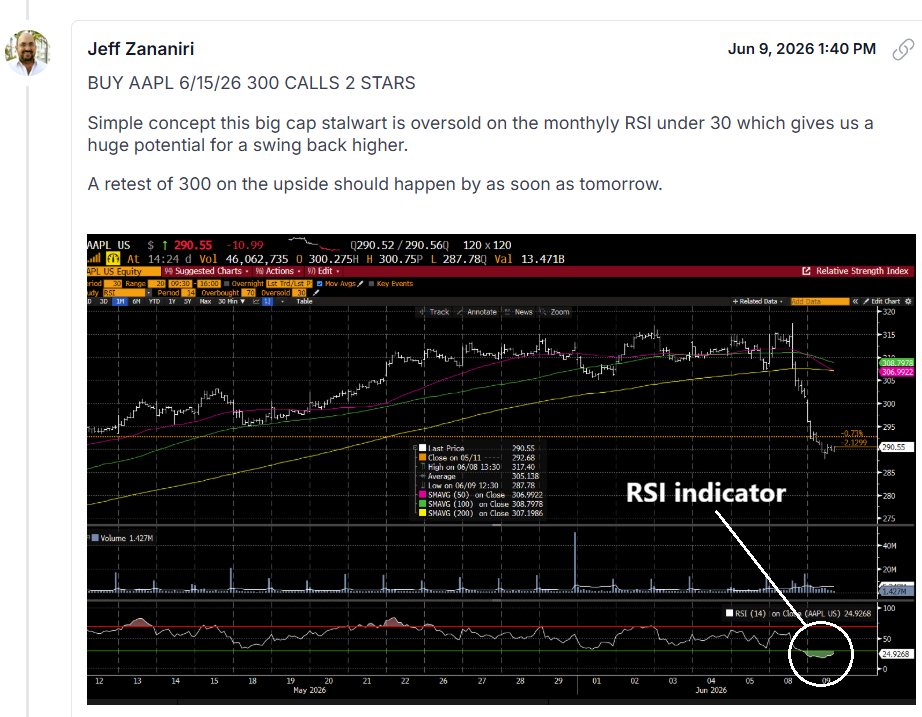
The thesis was simple. A solid blue-chip stock, this oversold, usually sets up a bounce higher.
I expected a retest of $300 on the upside, and I used short-dated options contracts to leverage a more volatile percent gain.
Two days after my alert, I sold my contracts.
You Don’t Have to Time It Perfectly
I didn’t nail the exact bottom…
And I didn’t sell at the exact top…
Almost nobody does.
The traders who lose on these plays are the ones who create a trade plan and use it as gospel.
They want the stock to follow their plan exactly. And they want to catch the entire move.
Are you really under the impression that you can outsmart the market? Why aim for perfection when an imperfect trade pays just as well?
There was a bunch of wiggle room on this chart…
I let the support/resistance levels and the RSI tell me when the stock was stretched too far. Then I bought contracts and kept some dry powder on the side just in case I needed to average down my position.
Being early and buying above the exact bottom, it isn’t wrong. It just means we’re not perfect.
Likewise, selling before it hits the top isn’t wrong. That’s how we lock in gains on a successful trade.
Don’t aim for perfection. Aim for gains.
Respect the Stop, Every Time
Let me be clear…
I only stay in a trade while the setup continues to hold. The second AAPL violates my risk level, I get out.
Win, loss, or scratch.
This time, my thesis paid out. AAPL was oversold, and it snapped back toward a key level ($300), exactly as planned.
I’m not going to time the market perfectly. Nobody does. So I protect myself first.
- Keep your expectations realistic.
- Size your positions so an early entry can’t wreck you.
- Guard your account above all else.
Watch for stocks that spike hard for several days in a row, or fall hard for several days in a row. That’s exactly where we use this pattern.
Once you find an overextended stock, check the RSI for a hint about coming reversals.
You saw a perfect example on AAPL.
Now you know what to look for.
Stay Street Smart,
Jeff Zananiri
*Past performance does not indicate future results, Not typical.