Congratulations!
We had a big win last week.
- I mentioned this setup during our Monthly Mastermind on Monday, December 8.
- And I alerted it again on Thursday, December 11 at 9:40 A.M. ET.
We’re sitting fat and happy right now.
The setup I alerted hit new 52-week highs on Friday December 12.
And while price dipped into the afternoon, it consolidated near the former breakout level. Which means we’re teed up for a volatile move this week.
Small caps are on fire right now. The most widely followed small-cap benchmark has outpaced larger indexes this year. It’s up more than the Dow and holding strong near record levels thanks to renewed risk appetite and hopes for easier Fed policy after the latest cut.
If you missed the move last week, I know exactly how you feel.
I’ve been there: Hungry, frustrated, and itching for the next opportunity.
Keep an eye on this key small-cap asset as it attempts to hold the breakout. And remember, with options, we can play both sides of this momentum.
Small-Cap Breakout
The asset we’re watching right now is IWM. The ETF that tracks the Russell 2000 Index, the most widely recognized benchmark for small-cap stocks in the U.S. market.
The Russell 2000 is a market-cap weighted index of roughly 2,000 smaller U.S. companies that gives us a read on how the small-cap segment is performing compared to big-cap benchmarks like the S&P 500 and the Dow.
Small caps are inherently more volatile than large caps. They grow faster when money flows into risk assets and get hit harder when fear returns.
That volatility is exactly what traders want when they’re looking for explosive moves. And this year, that’s exactly what we’ve seen.
The Russell 2000 has outpaced major indexes recently, outperforming the Dow and holding near record highs as investor optimism buoys.
Some analysts say small-caps are set up to outperform larger stocks, fueled by easier Fed policy, attractive valuations, and cyclical opportunities that big tech can’t offer.
Look at the headline below:
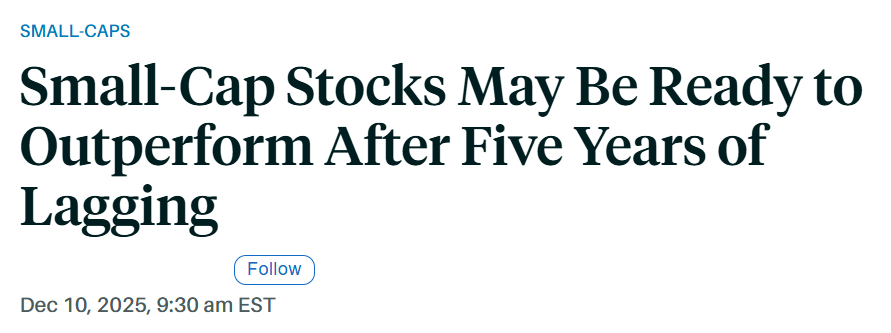
IWM is the heartbeat of small-cap momentum.
And as it approached 52-week highs last week, I was ready …
My Trade Alerts
I already mentioned, we spoke about a potential IWM surge on Monday, December 8.
On the chart below, every candle represents one trading day:
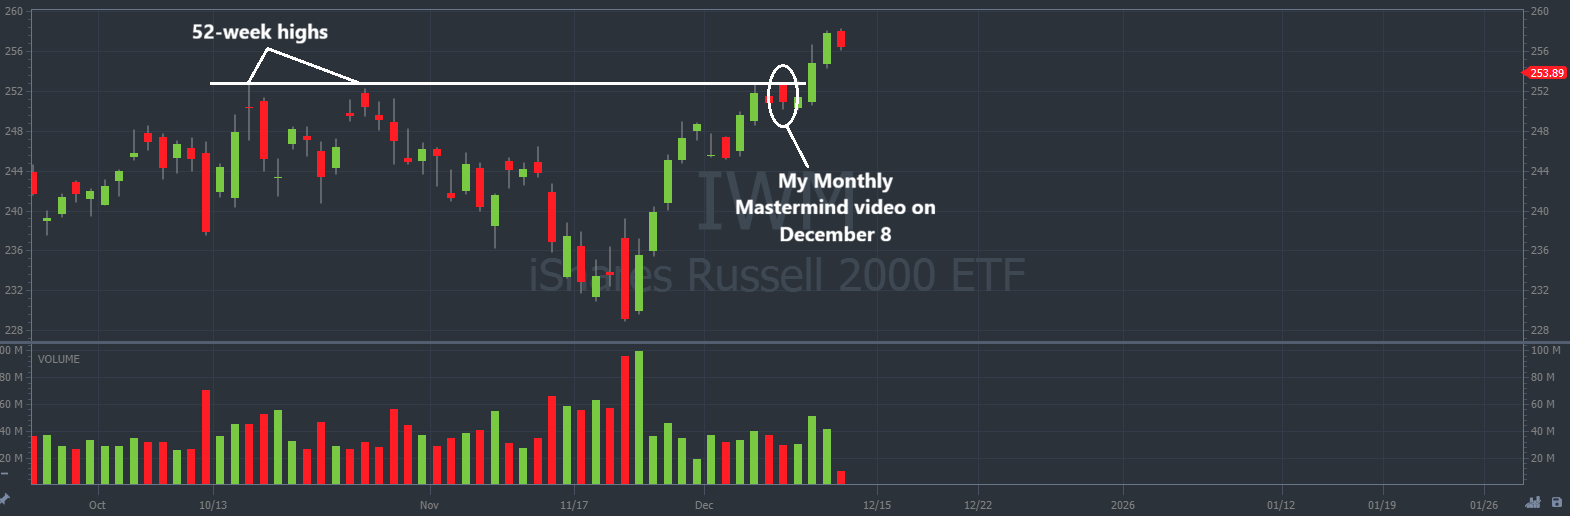
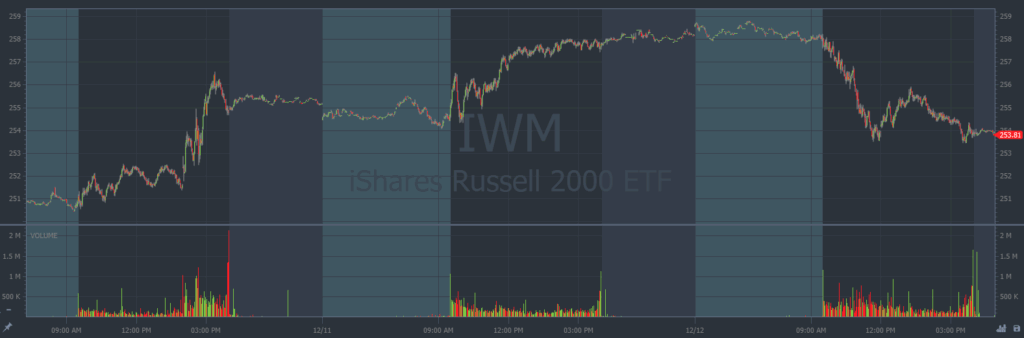
And here’s a look at my intraday alert on Thursday, December 11.
Every candle represents one trading minute:

It’s important that we keep our trades on the shorter end during this holiday volatility.
IWM offered a great bounce on Thursday and a push to new highs. But if I zoom out we can see the selloff that came on Friday.
Keep your risk tight in this environment and take singles into strength.
There’s nothing wiring with singles.
It all adds up over time.
At its current level, IWM could rally to retest the highs or sink lower as the January effect selloff begins. Either way, we can play that momentum.
Stand by for my next trade alert.
Stay Street Smart,
Jeff Zananiri