Happy Thursday, traders…
Jeff here.
A big part of my edge in the market comes down to macro trading.
I spend a lot of time parsing macroeconomic data, Bureau of Labor Statistics reports, and Federal Reserve commentary.
This may sound boring. You might be wondering why I put so much emphasis on these economic reports…

SPOILER ALERT: There’s nothing boring about making money.
Over 25 years of professional trading — much of it spent on Wall Street — I’ve learned just how much a single macroeconomic data point can rock the entire stock market … in either direction.
And over the next week or so, we’ll get a look at some of the most impactful economic reports of the year…
It all starts TONIGHT, April 4 at 8 p.m. EST … Tim Sykes is going LIVE to break down everything you need to know about the upcoming $2 Trillion Shock.
It continues tomorrow morning, when we’ll see the March U.S. jobs report.
(Analysts expect that the labor market added 200,000 jobs in March. That would be above pre-pandemic job growth, making it the 39th consecutive month the economy has added jobs.)
Then, next week, the Consumer Price Index (CPI) report — as well as the Federal Reserve minutes (transcripts from last month’s meeting) — will be released on April 10.
If you can learn how to use this macro data to predict market moves and inform your trading — you can be unstoppable.
But don’t just take it from me…
A recent market study explains the edge that macro trading provides better than I ever could…
Macro Events Account for 71% of All Stock Market Gains Over the Past 6 Decades
If you’ve ever doubted the profit-making potential of following major economic reports, it’s time to pay attention…
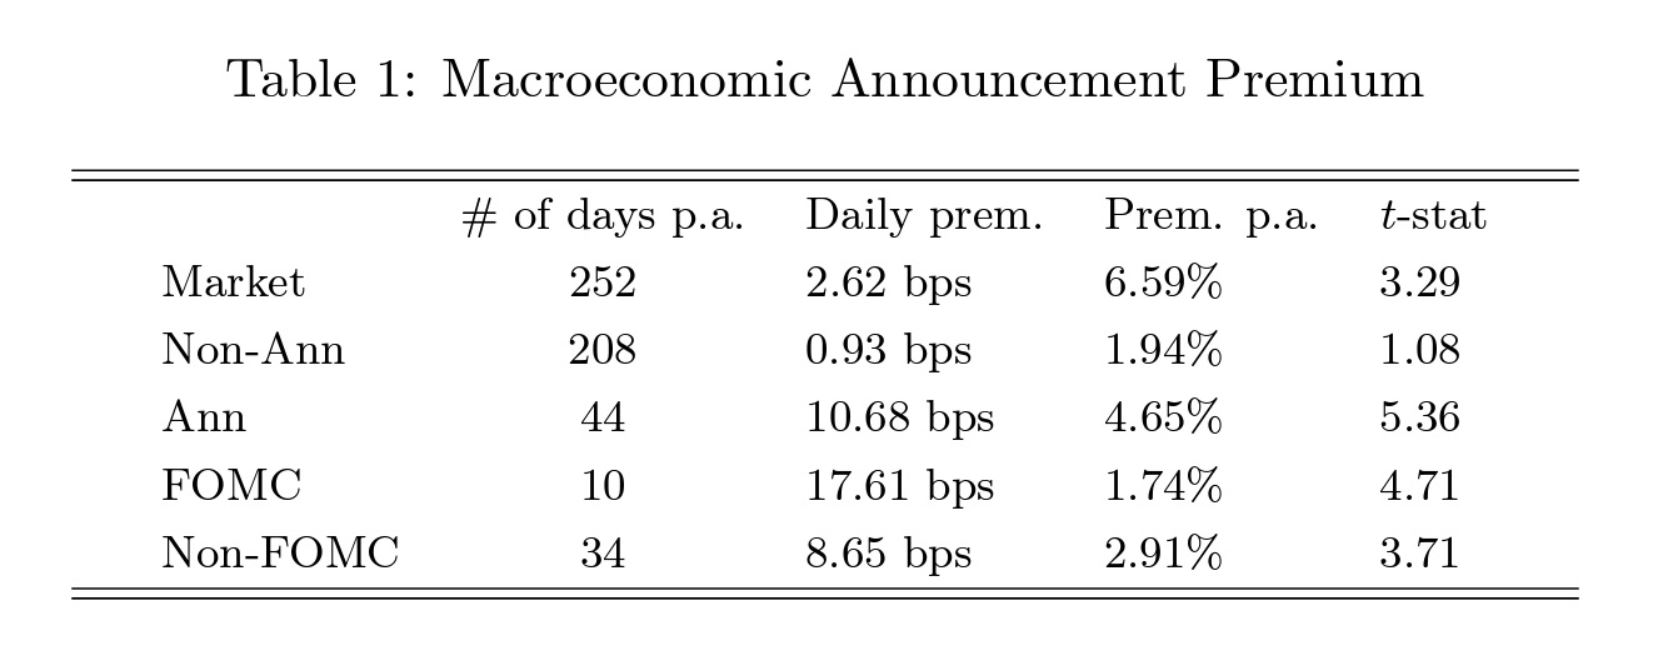
A recent research paper — Macroeconomic Announcement Premium by Hengjie Ai, Ravi Bansal, and Hongye Guo — is shedding fresh light on just how valuable macro trading can be.
Through their study of historical market data, they determined that “Since 1961, the 44 days a year where there has been major economic news account for over 71% of aggregate equity market returns.”
Let’s put this in perspective…
Since 1961, there have been roughly 15,625 trading days. Out of those, 44 days per year (approximately 2,728 days total) included major economic reports. And those 2,728 days—which accounted for just 17% of the total trading days since—made up a staggering 71% of the stock market’s total returns over the past 62 years.
In other words, you could’ve theoretically sat on the sidelines for 83% of the stock market’s action over the past six decades and still been there to trade on the most rip-roaring days.
That said, as evidenced by the price action over the last few days, it’s not only bullish setups that appear following major economic reports.
Some beautiful overnight fades and put-buying opportunities can arise amid economic data as well.
WARNING: Don’t be a perma-bull or perma-bear! Doing so will get you caught flat-footed whenever the market inevitably starts going in the opposite direction…
To be a fully-formed, flexible trader — you must take advantage of both the upside and the downside of market sentiment.
(It would be fascinating to see what % of stock market declines occurred around economic data, but we’ll have to wait for another report for that.)
13 Major Economic Reports To Put On Your Calendar
If you’re wondering how can you keep track of all the meaningful economic data coming down the pipe…
Here are thirteen more unignorable economic reports to keep on your calendar:
Non-Farm Payrolls (NFP) Report: Released monthly, it provides data on the number of jobs added or lost in the U.S. economy, excluding farm workers and certain other job classifications.
Unemployment Rate: Released alongside the NFP, it measures the % of the total workforce that is unemployed and actively seeking employment.
Consumer Price Index (CPI): A monthly report that measures changes in the price of consumer goods and services. (The next CPI report will be released on April 10.)
Producer Price Index (PPI): Released monthly, it measures the average change over time in the selling prices received by domestic producers for their output.
Retail Sales: A monthly measurement of all receipts from stores. It’s a primary gauge of consumer spending, which accounts for the majority of overall economic activity.
Gross Domestic Product (GDP): The broadest measure of economic activity, it represents the total value of all goods and services produced over a specific period. It’s released quarterly.
Personal Consumption Expenditures (PCE): Part of the monthly Personal Income and Outlays report, it measures price changes in consumer goods and services. (This is the Fed’s ‘preferred inflation gauge.’)
Durable Goods Orders: A monthly report that measures the cost of orders received by manufacturers for goods that are meant to last at least three years.
Federal Open Market Committee (FOMC) Meetings: While not a report per se, the meetings, announcements, and subsequent speeches from FOMC members about monetary policy and interest rate decisions are major market movers.
Consumer Confidence Index (CCI): Released monthly, it gauges the degree of optimism that consumers feel about the overall state of the economy (and their financial situation).
ISM Manufacturing Index: Released yesterday, this monthly report measures the health of the manufacturing sector.
ISM Non-Manufacturing Index: Similar to the Manufacturing Index, but for the services sector.
Housing Market Reports: Including New Home Sales, Existing Home Sales, Building Permits, and Housing Starts. These reports are released monthly and give insight into the health of the housing market.
If you fail to keep track of this macro data, you’ll be trading a market that’s digesting information you don’t even know exists.
This could lead to some missed wins or, worse, some big losses.
But by simply following these crucial economic reports, you might discover five-star trading opportunities that you wouldn’t have found otherwise.
Happy trading,
Jeff Zananiri
P.S. Speaking of five-star trading opportunities…
Unlike the rest of the market, you don’t need to wait months to discover the secret behind the upcoming $2 Trillion Shock…
TONIGHT, April 4 at 8 p.m. EST … Tim Sykes is going LIVE to break down everything you need to know about this major catalyst, including:
- Why 80 Wall Street banks are ALL moving their money ahead of this looming $2 trillion D.C. shock now…
- The way this shock could change everything for traders in the next 30 days…
- How Sykes was able to generate $2.2 million* in trading profits the last time this D.C. shock hit…
- His unique trade idea for this election-year shock, FREE…
- Why we could see a potential 300% peak move the day AFTER Sykes goes live…
- And much more…
This is your last chance — CLICK HERE TO RESERVE YOUR SEAT.
*Past performance does not indicate future results

