It’s easy to get tripped up in this market.
- Violence erupted between the U.S. and Iran again last weekend.
- The tech sector is deciding which way to turn at the bottom of a recent sell-off.
- We’re getting lots of jobs data this week, a fresh peek into the economy.
With so many catalysts swirling in the market, new traders understandably get distracted.
Focus on 2 tickers this week.
I’m here to coach you through this…
Understand that the market is not intuitive.
There’s a reason Warren Buffett is so infamous: the Oracle of Omaha is a statistical anomaly.
It’s highly unlikely that you’ll achieve success in the market from the get-go.
New traders are bound to make mistakes. I made mistakes when I started.
But with the right guidance, those mistakes turn into lessons. Then your mistakes grow fewer and farther between. Until one day you look around and realize… you’re a self-sufficient trader.
Follow my lead this week.
There are 2 main assets to watch.
I Fade the Crowd
I don’t guess where the market is headed next…
I wait for a chart to stretch too far in one direction, then I lean against the crowd.
We’ve discussed this strategy before.
Stock price action moves like a rubber band. Pull it far enough one way, and it snaps back. The buyers run dry at the top. The sellers run dry at the bottom. And their exhaustion is my trade opportunity.
Right now, the big semiconductors are stretched in one direction…
And the small caps are stretched in the other.
That’s the story I’m watching this week.
Top Stock #1: NVIDIA Corporation (NASDAQ: NVDA)
For years, traders treated semiconductors like a one-way ticket higher. Then the mood flipped.
There’s a fear that the cost of building AI is climbing faster than the profits can keep up.
The megacaps each shed at least 8% in June. A global chip rout ripped through Asia and Europe last week. And when the rest of the market tried to bounce on Friday, NVDA didn’t come along for the ride.
That’s the kind of weakness I pay attention to.
NVDA is still up 23% on the year. But the recent slide dragged it all the way back to resistance from 2025.
That resistance now acts as support. And we’re at a pivotal moment to test its strength.
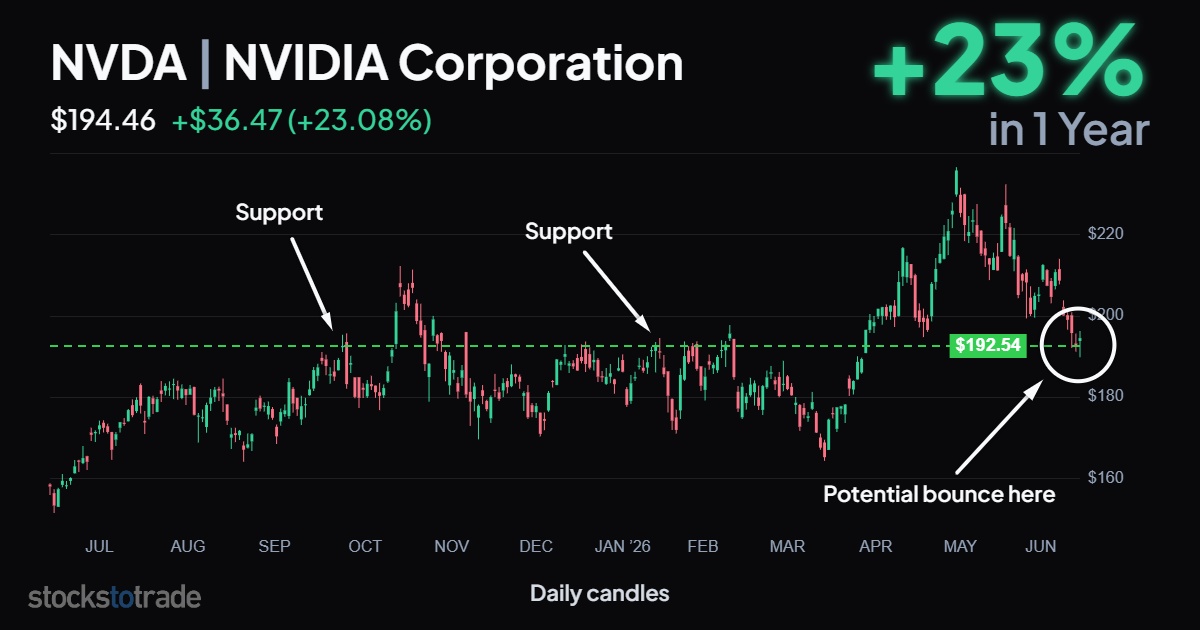
Here’s the question every chip trader is asking: Did NVDA bottom last week, or is there another leg lower coming?
I’m not going to guess the answer. I’m going to let the chart tell me.
If NVDA holds this level and stumbles back to life, it could rally substantially. If it slices through support instead, there could be more downside before a reversal.
I’ll wait for the floor to prove itself. Then I’ll make my move.
Top Stock #2: iShares Russell 2000 ETF (NYSE: IWM)
While the blue chips burn, the small-caps are throwing a party.
The IWM holds roughly 2,000 small-cap names. The smaller, scrappier companies that sit just below the giant tech stocks everyone obsesses over.
And while those giants get crushed, small caps have quietly run to the front of the pack.
Money is flowing out of the expensive megacaps and into the smaller names that used to always fall by the wayside.
The Russell 2000 is now beating the S&P 500 by the widest margin since 2003.
It’s up 38% over the past year and still knocking on all-time highs.
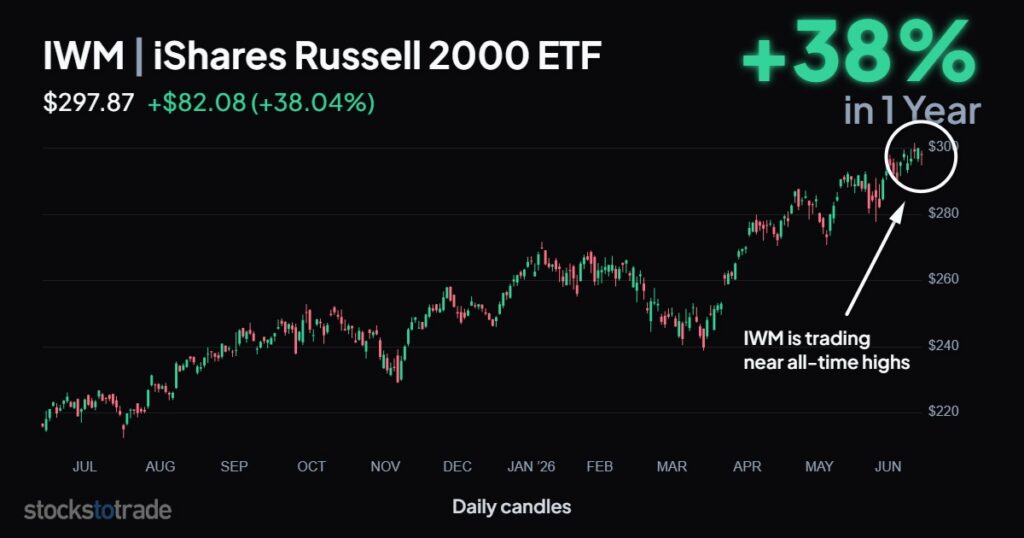
And it’s running straight into a key psychological level: $300 per share.
Round numbers like $300 can act as their own volatile catalysts. Buyers see a clean breakout above it. Sellers see a chance to take profits before a rejection.
Both camps draw their line in the sand at the same spot, which is exactly why the level carries so much weight.
There’s another fresh catalyst, too. The annual Russell reconstitution, the once-a-year rebuild of the index, took effect after Friday’s close. The lineup this week is completely refreshed.
A shuffle with this level of performance forces traders and investors alike to reevaluate their positions in the index. Buy more, or sell?
We’re about to find out what the crowd decides…
Here’s the divergence I can’t stop watching: the big AI names are falling apart while small caps sit at record highs. That split can’t last forever. One side has to give.
I could play the IWM in one of two ways, and $300 is the key level for both strategies.
If the IWM pushes above $300 and holds, the continued momentum has legs.
If the IWM stalls at $300 and gets rejected, the small caps are finally rolling over to meet the broader market’s bearish turn.
I don’t pick a side. The chart picks one for me.
Stay Disciplined This Week
I’m watching two setups with two clean levels.
NVDA tells me whether the chip sell-off has found a bottom. IWM tells me whether the small-cap party keeps going or the whole market rolls over together.
Don’t force either trade. Let the chart confirm the move first. And protect your account against any failed moves.
Keep your head on a swivel this week. The June jobs report hits on Thursday, the Iran headlines are flaring back up, and a fresh Russell index is finding its footing.
There’s a lot of fuel for the volatility that we love to trade.
Take advantage of it.
Stay Street Smart,
Jeff Zananiri
*Past performance does not indicate future results, Not typical.