
I warned you for weeks: The parabolic moves in the precious metals sector wouldn’t last forever.
And on January 30, the prophecy came true …
The rocket just blew a gasket and the iShares Silver Trust (NYSE: SLV) cratered.
On the chart below, every candle represents one trading day:
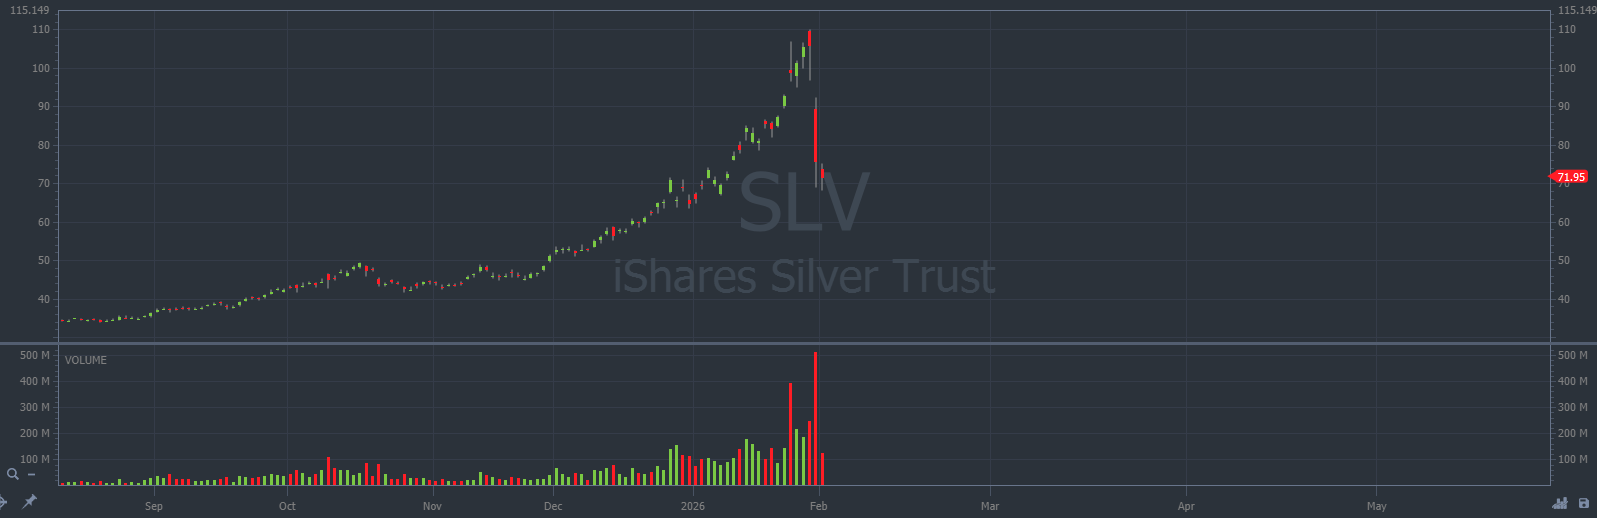
The chart showed us a textbook “first red day” setup for anyone who recognized the selloff was underway.
If you missed it … Yeah, it stings.
That was the move we’d been talking about for weeks.
Here’s the good news: This isn’t a one-and-done headline. This sector is still extremely volatile. When a sector runs mile-high and then implodes in hours, the tape doesn’t just magically normalize.
We can find second and third chances in this after-shock price action.
If you felt the FOMO seeing SLV plummet, channel it.
I’m lining up the next shots as we speak: Key levels are marked and I’ve got defined risk.
Consider this your wake-up call.
These opportunities don’t wait.
The Precious Metals Boom and Bust
The precious metals move in 2026 didn’t come out of nowhere.
Silver ripped nearly 150% in 2025 and piled on another 25% in the first two weeks of 2026, fueled by safe-haven flows, rate-cut hopes, a softer dollar early on, and monster ETF demand.
Add the industrial uses (EVs/solar/chips) and you had a double-engine squeeze powering fresh highs almost every day.
Gold rode shotgun the whole way, printing its own records as fear and FOMO fed on each other.
Then, almost overnight, the sentiment flipped: President Trump nominated Kevin Warsh, a more hawkish, dollar-friendly pick, to replace Powell. The greenback perked up and suddenly the feedback loop that lifted metals ran in reverse.
Result: the largest one-day drops in 40+ years and a brutal SLV air pocket.
This sector run was real. There were multiple macro catalysts to push prices higher. But this implosion is real too.
And due to the extreme volatility we’re seeing, this sector won’t normalize overnight. Keep your eyes on the tape. After shocks like this, second and third chances tend to show up for traders who are actually prepared.
Where From Here?
SLV just printed the kind of play that we love to stalk in the market.
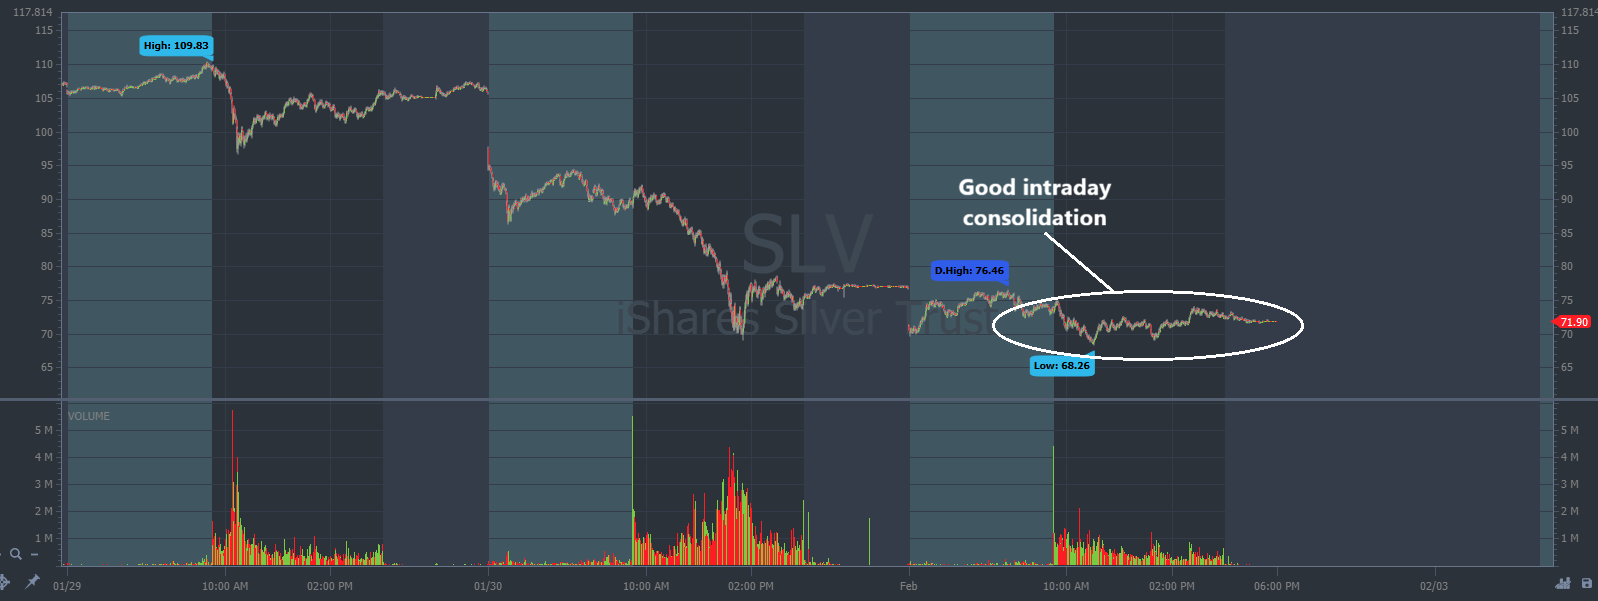
After Friday’s rug pull, on Monday, February 2, SLV settled into a consolidation instead of another freefall.
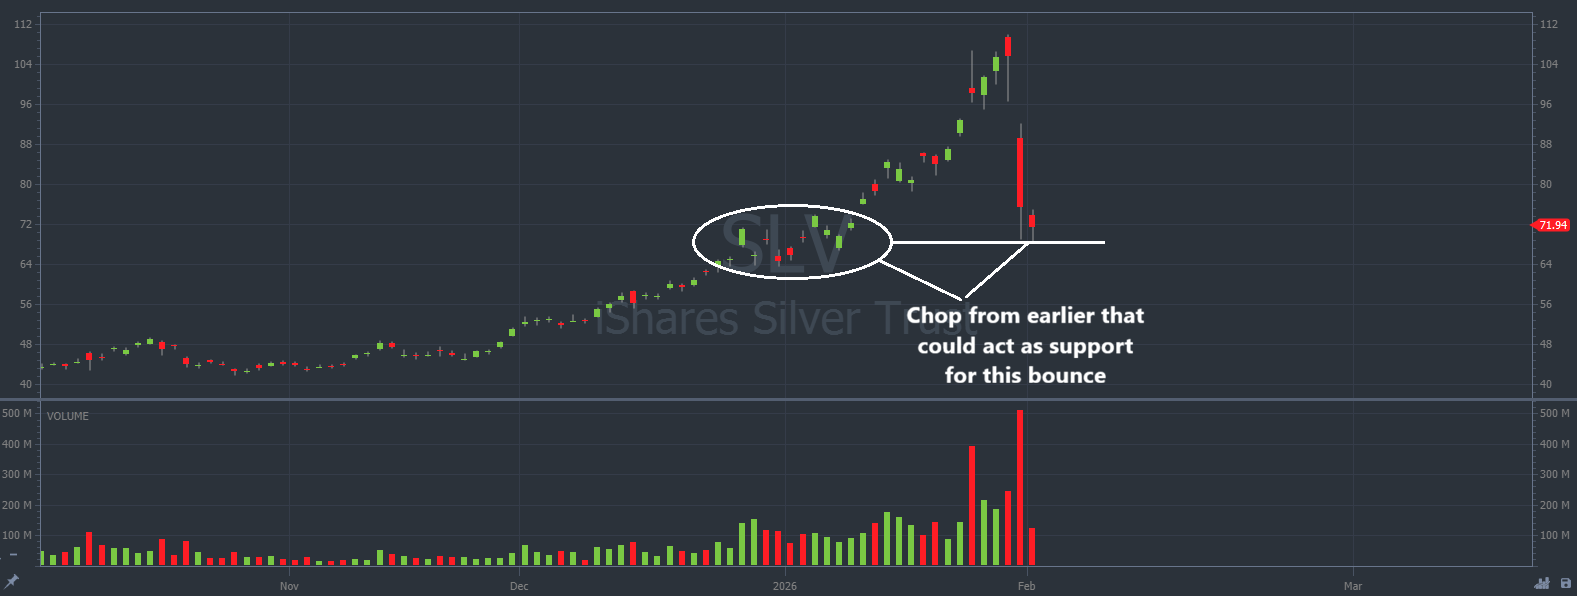
On the first SLV chart, every candle represents one trading minute. On the second chart every candle represents one trading day:
That’s our battle zone.
And here’s our edge: We don’t need to predict which way the price goes to win.
With options, we can trade both sides of the momentum, with defined risk, once we confirm market sentiment from the price action that matches our patterns.
For example, quick Calls on a clean reclaim, or Puts into a failed bounce/a dip below support.
Let the tape tip its hand, then react and take the meat of the move.
The true market opportunity comes from our reaction to the price, not a guess about where the price might be.
“But Jeff, I don’t have enough money to make big gains in the market.”
Sorry, you’ve been lied too. Small-accounts are killing it right now … $5k turned into $493k in just 60 days.*
That’s a 9,700%* gain in two months! And coincidentally, we’re just over two months away from Tax Day.
How To Flip a Small Account in 60 Days.
There are new opportunities every single day in this market. Stop wasting time!
Stay Street Smart,
Jeff Zananiri
*Past performance does not indicate future results, Not typical.