I just sent another alert for another win.
Had you traded alongside me this week, you could’ve locked in solid gains on a household name…
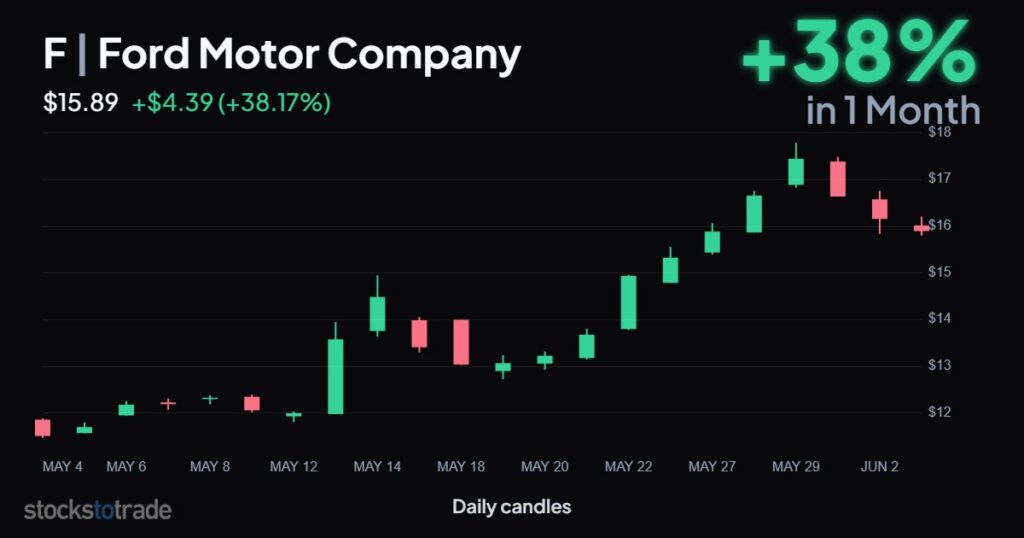
Ford Motor Company (NYSE: F)
And we used a simple pattern.
Ford is hardly the most popular stock in the market… you won’t see it next to buzzwords like “AI” or “data centers”.
But the setup that just paid us is the same setup I look for in the market over and over again.
It shows up in every environment, on every timeframe, and on every kind of stock.
The pattern might not jump out at you from this chart…
That’s because you don’t know what to look for yet.
Once you learn this setup, you can’t unlearn it.
Get ready for more opportunities with this repeating pattern…
Stocks Don’t Run Forever
Stocks don’t move in one direction forever.
It doesn’t matter whether it’s the high-flying tech darlings, the sleepy old-economy names, or sketchy penny stocks that soar +1,000% intraday…
- A stock that rips higher eventually runs out of buyers.
- A stock that bleeds lower eventually runs out of sellers.
I’m not in the business of guessing tops and bottoms on a hunch. I’m hunting the moment a crowded trade gets stretched so far in one direction that the snapback becomes the highest-probability move.
Up too far, I look for the drop. Down too far, I look for the bounce. Either way, I’m trading the change in direction.
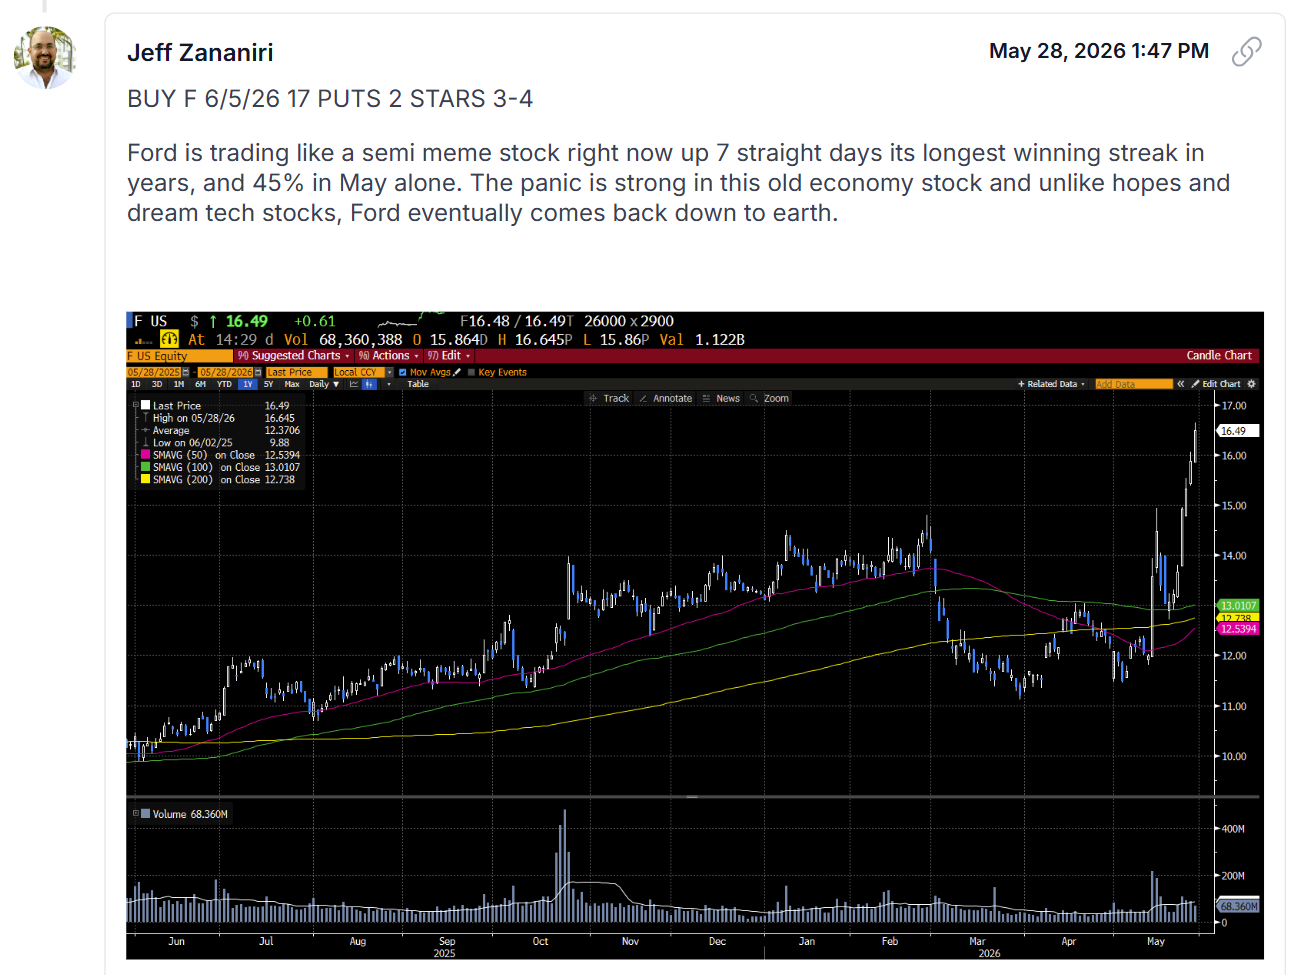
Ford handed me a textbook version of this setup…
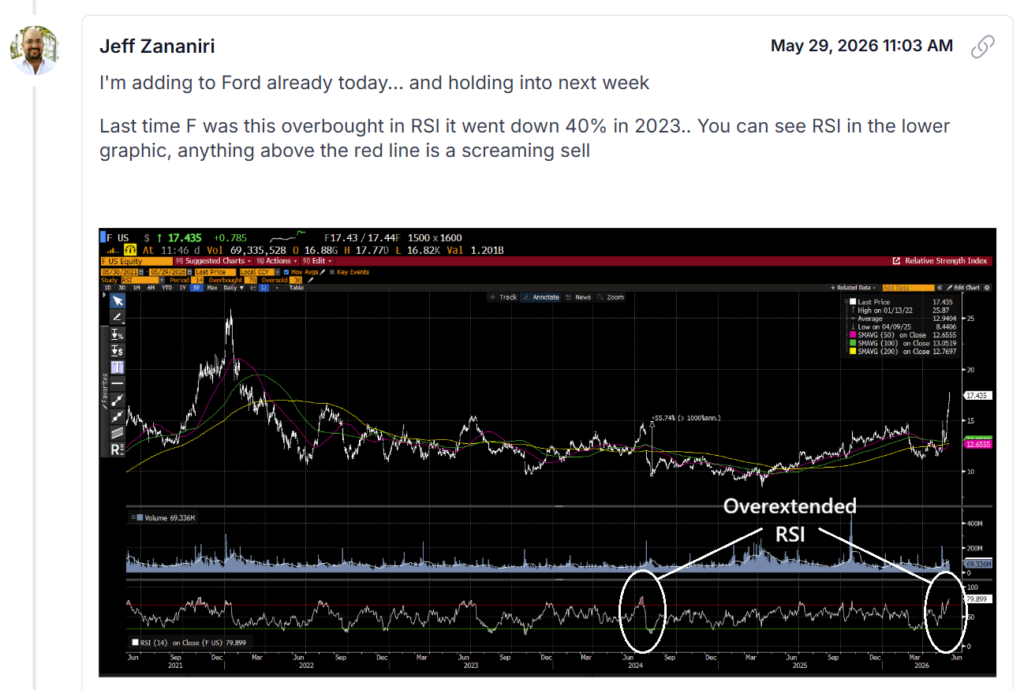
The RSI Was Screaming
How did I know Ford was stretched too far?
The Relative Strength Index.
The RSI measures momentum on a scale of 0 to 100. The higher the number, the greater the chance of a pullback. And the opposite is also true.
By May 29, Ford’s 14-day RSI pushed to nearly 80. That points toward an exhausted price spike.
The last time F got this stretched on the RSI, the stock fell 40%, back in 2023.
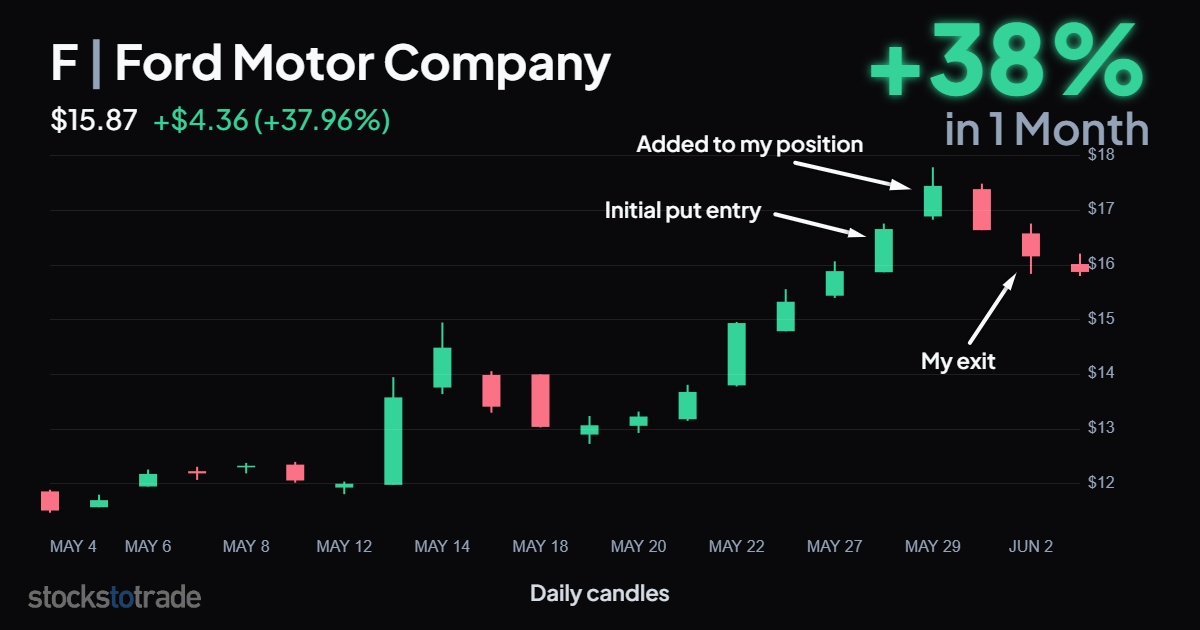
So I bought the June 5, $17 Puts and waited for Ford to come back down to earth.
You Don’t Have to Time It Perfectly
I didn’t nail the entry. Almost nobody does.
I bought my first puts on May 28. But the next session, the stock didn’t roll over. It pushed higher.
My position was underwater.
That’s the part that shakes most people out. They see red on day one and decide the thesis is broken. Or they refuse to act, and their position drifts into loss territory despite a solid setup.
I did the opposite. I added to the position on May 29, right as the RSI hit its most extreme.
I averaged up into a stronger setup instead of panic-selling a temporary loss. And a few days later, I got the move I wanted.

The trick is keeping dry powder on hand.
I never throw my full position at a trade on the first entry. I always leave room to add when a stretched stock gives me an even better price.
Being early isn’t wrong. It just means the move hasn’t caught up to our thesis yet.
Don’t Double Down on Everything
Let me be clear…
Adding to a loser is a risky move.
I only add when the setup is still intact, and the chart hasn’t violated my risk level.
The thesis on Ford was alive and well. The stock was getting more overbought. That’s a green light to add.
Respect your stop. Every time.
We’re not going to time the market perfectly. Nobody does.
So…
- Keep your expectations realistic.
- Size your positions so an early entry doesn’t wreck you.
- And protect your account above everything else.
Pay attention to stocks that run for multiple days or fall for multiple days.
There’s a momentum switch coming.
Stay Street Smart,
Jeff Zananiri
*Past performance does not indicate future results, Not typical.